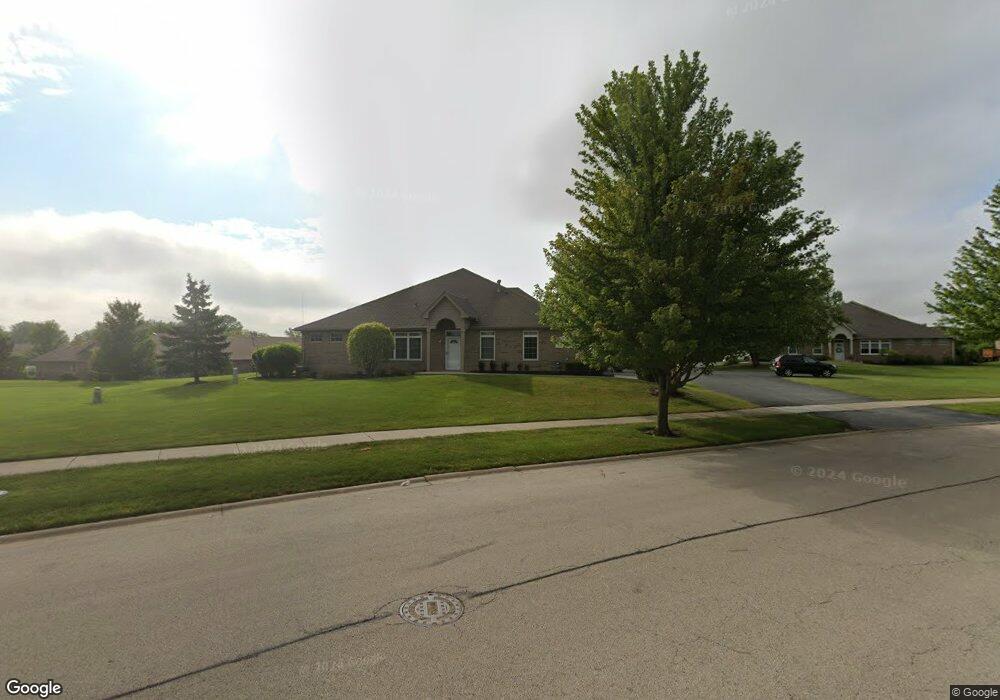
10503 Thornham Ln Mokena, IL 60448
Estimated Value: $301,534 - $364,000
2
Beds
2
Baths
1,392
Sq Ft
$238/Sq Ft
Est. Value
About This Home
This home is located at 10503 Thornham Ln, Mokena, IL 60448 and is currently estimated at $331,384, approximately $238 per square foot. 10503 Thornham Ln is a home located in Will County with nearby schools including Mokena Elementary School, Mokena Intermediate School, and Mokena Jr High School.
Ownership History
Date
Name
Owned For
Owner Type
Purchase Details
Closed on
Jun 19, 2009
Sold by
Branigan John P
Bought by
Khan Farha S
Current Estimated Value
Home Financials for this Owner
Home Financials are based on the most recent Mortgage that was taken out on this home.
Original Mortgage
$199,323
Outstanding Balance
$126,951
Interest Rate
4.92%
Mortgage Type
FHA
Estimated Equity
$204,433
Purchase Details
Closed on
Feb 6, 2006
Sold by
Chellino Wesley S
Bought by
Branigan John P
Home Financials for this Owner
Home Financials are based on the most recent Mortgage that was taken out on this home.
Original Mortgage
$168,000
Interest Rate
6.3%
Mortgage Type
Fannie Mae Freddie Mac
Purchase Details
Closed on
May 26, 2004
Sold by
Standard Bank & Trust Co
Bought by
Chellino Wesley S
Home Financials for this Owner
Home Financials are based on the most recent Mortgage that was taken out on this home.
Original Mortgage
$162,048
Interest Rate
4.37%
Mortgage Type
Purchase Money Mortgage
Create a Home Valuation Report for This Property
The Home Valuation Report is an in-depth analysis detailing your home's value as well as a comparison with similar homes in the area
Home Values in the Area
Average Home Value in this Area
Purchase History
| Date | Buyer | Sale Price | Title Company |
|---|---|---|---|
| Khan Farha S | $203,000 | Ticor Title Insurance Co | |
| Branigan John P | $210,000 | None Available | |
| Chellino Wesley S | $203,000 | Chicago Title Insurance Co |
Source: Public Records
Mortgage History
| Date | Status | Borrower | Loan Amount |
|---|---|---|---|
| Open | Khan Farha S | $199,323 | |
| Previous Owner | Branigan John P | $168,000 | |
| Previous Owner | Chellino Wesley S | $162,048 |
Source: Public Records
Tax History Compared to Growth
Tax History
| Year | Tax Paid | Tax Assessment Tax Assessment Total Assessment is a certain percentage of the fair market value that is determined by local assessors to be the total taxable value of land and additions on the property. | Land | Improvement |
|---|---|---|---|---|
| 2024 | $6,104 | $88,463 | $780 | $87,683 |
| 2023 | $6,104 | $79,006 | $697 | $78,309 |
| 2022 | $5,361 | $71,961 | $635 | $71,326 |
| 2021 | $5,035 | $67,322 | $594 | $66,728 |
| 2020 | $4,926 | $65,424 | $577 | $64,847 |
| 2019 | $4,768 | $63,673 | $562 | $63,111 |
| 2018 | $4,605 | $61,843 | $546 | $61,297 |
| 2017 | $4,516 | $60,399 | $533 | $59,866 |
| 2016 | $4,384 | $58,329 | $515 | $57,814 |
| 2015 | $4,258 | $56,275 | $497 | $55,778 |
| 2014 | $4,258 | $55,884 | $494 | $55,390 |
| 2013 | $4,258 | $60,026 | $1,986 | $58,040 |
Source: Public Records
Map
Nearby Homes
- 10521 Thornham Ln Unit 10521
- 19242 104th Ave
- 19246 104th Ave Unit 19246
- 19207 104th Ave
- Lots 4,5, & 6 191st St
- Vacant 191st St
- 19525 Fiona Ave
- 19542 Fiona Ave
- 10658 Revere Cir
- 10111 Cambridge Ct Unit Court-G
- 10508 W La Porte Rd
- 10015 Cambridge Dr
- 9860 Stafford Ct
- 12 187th St
- 20044 S Kohlwood Dr
- 19380 Wolf Rd Unit 5
- 19380 Wolf Rd Unit 6
- 18714 Wren Cir
- 19060 Everett Blvd
- 19300 Wolf Rd Unit 2
- 10507 Thornham Ln Unit 10507
- 10503 Thornham Ln Unit 10503
- 10505 Thornham Ln Unit 10505
- 10501 Thornham Ln Unit 10501
- 10509 Thornham Ln Unit 10509
- 10511 Thornham Ln Unit 10511
- 10513 Thornham Ln Unit 10513
- 10515 Thornham Ln Unit 10515
- 10515 Thornham Ln Unit 1
- 10519 Thornham Ln Unit 10519
- 10523 Thornham Ln Unit 10523
- 19236 104th Ave Unit 19236
- 19234 104th Ave Unit 19234
- 19230 104th Ave Unit 19230
- 19232 104th Ave Unit 2
- 19234 104th Ave Unit 3
- 19236 104th Ave Unit 4
- 19245 Crescent Dr Unit 1924
- 19249 Crescent Dr Unit 19249
- 19247 Crescent Dr Unit 19247