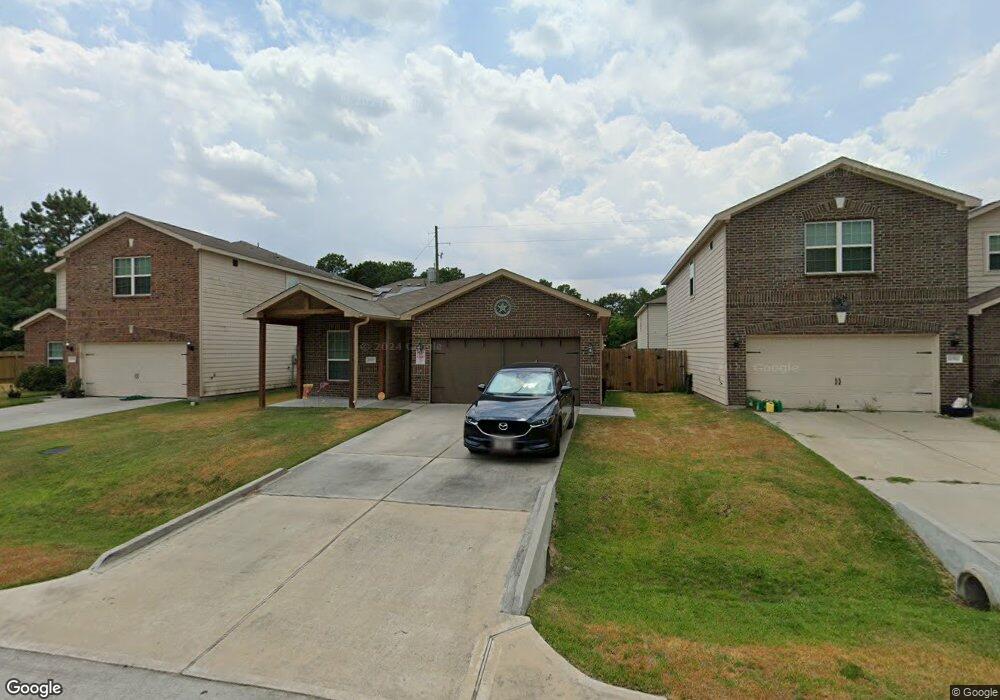
10507 Logger Pine Trails Trail Houston, TX 77088
North Houston NeighborhoodEstimated Value: $234,244 - $245,000
3
Beds
2
Baths
1,637
Sq Ft
$146/Sq Ft
Est. Value
About This Home
This home is located at 10507 Logger Pine Trails Trail, Houston, TX 77088 and is currently estimated at $239,061, approximately $146 per square foot. 10507 Logger Pine Trails Trail is a home located in Harris County with nearby schools including Stovall School, Caraway Intermediate School, and Caraway Elementary School.
Ownership History
Date
Name
Owned For
Owner Type
Purchase Details
Closed on
Nov 9, 2024
Sold by
Pham Cuong
Bought by
Nguyen Tiffany and Pham Cuong
Current Estimated Value
Purchase Details
Closed on
Aug 22, 2023
Sold by
Crockett Darin Arnett and Crockett Kimberly Lucole
Bought by
Pham Cuong
Home Financials for this Owner
Home Financials are based on the most recent Mortgage that was taken out on this home.
Original Mortgage
$177,452
Interest Rate
6.81%
Mortgage Type
FHA
Purchase Details
Closed on
Dec 19, 2017
Sold by
Lgi Homes Texas Llc
Bought by
Crockett Darin Arnett
Home Financials for this Owner
Home Financials are based on the most recent Mortgage that was taken out on this home.
Original Mortgage
$179,900
Interest Rate
3.9%
Mortgage Type
VA
Create a Home Valuation Report for This Property
The Home Valuation Report is an in-depth analysis detailing your home's value as well as a comparison with similar homes in the area
Home Values in the Area
Average Home Value in this Area
Purchase History
| Date | Buyer | Sale Price | Title Company |
|---|---|---|---|
| Nguyen Tiffany | -- | None Listed On Document | |
| Nguyen Tiffany | -- | None Listed On Document | |
| Pham Cuong | -- | Wfg National Title Company | |
| Crockett Darin Arnett | -- | Texas American Title Co |
Source: Public Records
Mortgage History
| Date | Status | Borrower | Loan Amount |
|---|---|---|---|
| Previous Owner | Pham Cuong | $177,452 | |
| Previous Owner | Crockett Darin Arnett | $179,900 |
Source: Public Records
Tax History Compared to Growth
Tax History
| Year | Tax Paid | Tax Assessment Tax Assessment Total Assessment is a certain percentage of the fair market value that is determined by local assessors to be the total taxable value of land and additions on the property. | Land | Improvement |
|---|---|---|---|---|
| 2025 | $6,124 | $246,932 | $40,820 | $206,112 |
| 2024 | $6,124 | $235,489 | $40,820 | $194,669 |
| 2023 | $6,124 | $247,773 | $40,820 | $206,953 |
| 2022 | $6,409 | $215,726 | $28,553 | $187,173 |
| 2021 | $6,053 | $175,166 | $28,553 | $146,613 |
| 2020 | $6,191 | $173,330 | $28,553 | $144,777 |
| 2019 | $6,449 | $195,086 | $28,553 | $166,533 |
| 2018 | $0 | $173,959 | $28,553 | $145,406 |
| 2017 | $453 | $12,690 | $12,690 | $0 |
| 2016 | $453 | $12,690 | $12,690 | $0 |
| 2015 | $194 | $12,690 | $12,690 | $0 |
| 2014 | $194 | $12,690 | $12,690 | $0 |
Source: Public Records
Map
Nearby Homes
- 10506 Pine Landing Dr
- 10527 Logger Pine Trail
- 10555 Logger Pine Trail
- 2234 Hampton St
- 2326 Wavell St
- 2020 & 2022 Wavell St
- 2026 Wavell St
- 2325 Hampton St
- 10634 Logger Pine Trail
- 1918 Hampton St
- 10642 Logger Pine Trail Unit B
- 2330 Wavell St
- 2106 Dewalt St Unit A
- 9298 Plan at Shiloh Reserve
- 9297 Plan at Shiloh Reserve
- 9299 Plan at Shiloh Reserve
- 2110 Dewalt St Unit G
- 2415 Fallen Pine Ln
- 2418 Fallen Pine Ln
- 2422 Fallen Pine Ln
- 10507 Logger Pine Trail
- 10511 Logger Pine Trail
- 10503 Logger Pine Trail
- 10510 Pine Landing Dr
- 10502 Pine Landing Dr
- 10515 Logger Pine Trail
- 10514 Pine Landing Dr
- 10519 Logger Pine Trail
- 10518 Pine Landing Dr
- 10502 Logger Pines Trail
- 10506 Logger Pine Trail
- 10502 Logger Pine Trails
- 10510 Logger Pine Trail
- 10523 Logger Pines Trail
- 10514 Logger Pine Trail
- 10523 Logger Pine Trails
- 10522 Pine Landing Dr
- 10518 Logger Pine Trail
- 10507 Pine Landing Dr
- 10511 Pine Landing Dr