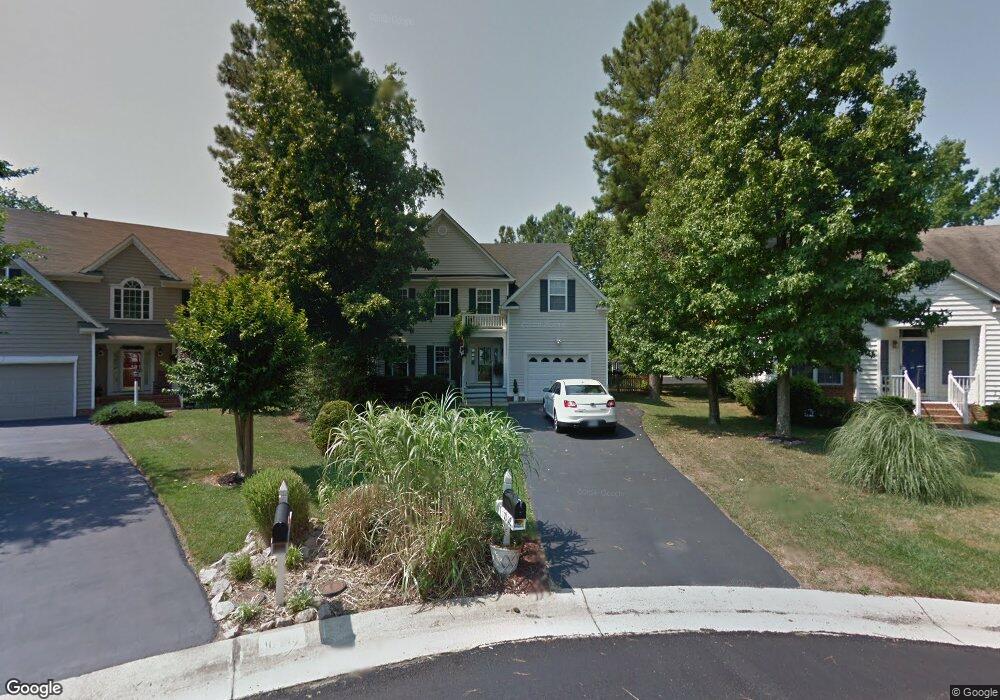
10508 Runnymeade Dr Glen Allen, VA 23059
Estimated Value: $479,564 - $501,000
4
Beds
3
Baths
2,248
Sq Ft
$218/Sq Ft
Est. Value
About This Home
This home is located at 10508 Runnymeade Dr, Glen Allen, VA 23059 and is currently estimated at $489,891, approximately $217 per square foot. 10508 Runnymeade Dr is a home located in Henrico County with nearby schools including Greenwood Elementary School, Hungary Creek Middle School, and Glen Allen High School.
Ownership History
Date
Name
Owned For
Owner Type
Purchase Details
Closed on
Sep 30, 2019
Sold by
Cox Brian David and Walls Angela Dawn
Bought by
Walls Angela Dawn
Current Estimated Value
Purchase Details
Closed on
Aug 28, 2008
Sold by
Hottle Roy B
Bought by
Cox Brian D and Walls,Angela D
Home Financials for this Owner
Home Financials are based on the most recent Mortgage that was taken out on this home.
Original Mortgage
$281,484
Outstanding Balance
$188,742
Interest Rate
6.69%
Mortgage Type
FHA
Estimated Equity
$301,149
Purchase Details
Closed on
Oct 31, 2006
Sold by
Taggart William K
Bought by
Hottle Roy B and Canada,Vikki
Home Financials for this Owner
Home Financials are based on the most recent Mortgage that was taken out on this home.
Original Mortgage
$209,000
Interest Rate
6.47%
Mortgage Type
New Conventional
Purchase Details
Closed on
Jul 25, 2002
Sold by
Stanley J C Inc
Bought by
Taggart William K and Taggart Jody A
Purchase Details
Closed on
Sep 17, 1997
Create a Home Valuation Report for This Property
The Home Valuation Report is an in-depth analysis detailing your home's value as well as a comparison with similar homes in the area
Home Values in the Area
Average Home Value in this Area
Purchase History
| Date | Buyer | Sale Price | Title Company |
|---|---|---|---|
| Walls Angela Dawn | -- | None Available | |
| Cox Brian D | $284,000 | -- | |
| Hottle Roy B | $299,000 | -- | |
| Taggart William K | $193,000 | -- | |
| -- | $39,500 | -- |
Source: Public Records
Mortgage History
| Date | Status | Borrower | Loan Amount |
|---|---|---|---|
| Open | Cox Brian D | $281,484 | |
| Previous Owner | Hottle Roy B | $209,000 |
Source: Public Records
Tax History Compared to Growth
Tax History
| Year | Tax Paid | Tax Assessment Tax Assessment Total Assessment is a certain percentage of the fair market value that is determined by local assessors to be the total taxable value of land and additions on the property. | Land | Improvement |
|---|---|---|---|---|
| 2025 | $3,408 | $404,400 | $85,000 | $319,400 |
| 2024 | $3,408 | $392,700 | $82,000 | $310,700 |
| 2023 | $3,338 | $392,700 | $82,000 | $310,700 |
| 2022 | $2,950 | $347,000 | $75,000 | $272,000 |
| 2021 | $2,816 | $313,000 | $75,000 | $238,000 |
| 2020 | $2,723 | $313,000 | $75,000 | $238,000 |
| 2019 | $2,625 | $301,700 | $70,000 | $231,700 |
| 2018 | $2,562 | $294,500 | $65,000 | $229,500 |
| 2017 | $2,396 | $275,400 | $65,000 | $210,400 |
| 2016 | $2,297 | $264,000 | $60,000 | $204,000 |
| 2015 | $2,246 | $250,500 | $55,000 | $195,500 |
| 2014 | $2,246 | $258,200 | $52,000 | $206,200 |
Source: Public Records
Map
Nearby Homes
- 1629 Main Blvd
- 1643 Main Blvd
- 10624 Runnymeade Dr
- 1226 Old Francis Rd
- 10702 Skippers St
- 10698 Skippers St
- 10700 River Fall Path
- 922 Ward Rd
- 10229 Berrymeade Ct
- 10812 Kilpatrick Ln
- 10147 Berrymeade Place
- 1913 Sharbel Cir
- 1919 Knotty Way Dr
- 909 Harmony Rd
- 10155 Virginia Rd
- 1200 Cole Blvd
- 9875 Tuco St Unit B
- 9877 Tuco St Unit B
- 9875 Tuco St Unit A
- 9877 Tuco St Unit A
- 10504 Runnymeade Dr
- 10512 Runnymeade Dr
- 10500 Runnymeade Dr
- 10400 Runnymeade Dr
- 10516 Runnymeade Dr
- 10004 Scotts Ridge Ct
- 10501 Runnymeade Dr
- 10520 Runnymeade Dr
- 10008 Scotts Ridge Ct
- 10001 Scotts Ridge Ct
- 10505 Runnymeade Dr
- 10012 Scotts Ridge Ct
- 1805 Holliman Dr
- 1251 Virginia Center Pkwy
- 10517 Runnymeade Dr
- 10509 Runnymeade Dr
- 10524 Runnymeade Dr
- 10513 Runnymeade Dr
- 10016 Scotts Ridge Ct
- 10521 Runnymeade Dr