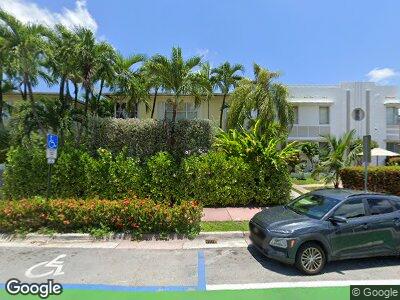
1051 Euclid Ave Unit 209 Miami Beach, FL 33139
Flamingo NeighborhoodEstimated Value: $290,000 - $386,000
1
Bed
1
Bath
630
Sq Ft
$508/Sq Ft
Est. Value
About This Home
This home is located at 1051 Euclid Ave Unit 209, Miami Beach, FL 33139 and is currently estimated at $319,743, approximately $507 per square foot. 1051 Euclid Ave Unit 209 is a home located in Miami-Dade County with nearby schools including Fienberg-Fisher K-8 Center, Nautilus Middle School, and Miami Beach Senior High School.
Ownership History
Date
Name
Owned For
Owner Type
Purchase Details
Closed on
Jul 29, 2005
Sold by
Castaneda Yvonne
Bought by
Antenucci Angelo
Current Estimated Value
Home Financials for this Owner
Home Financials are based on the most recent Mortgage that was taken out on this home.
Original Mortgage
$180,000
Outstanding Balance
$97,259
Interest Rate
5.25%
Mortgage Type
Unknown
Estimated Equity
$206,142
Purchase Details
Closed on
Feb 11, 2004
Sold by
Castaneda Yvonne and Brain Benedict
Bought by
Castaneda Yvonne
Purchase Details
Closed on
Nov 1, 2002
Sold by
Shahinian John and Shahinian Kathy
Bought by
Benedict Brian and Castaneda Yvonne
Purchase Details
Closed on
Oct 1, 2002
Sold by
Shahinian John and Shahinian Kathy
Bought by
Brian Benedict and Castaneda Yvonne
Purchase Details
Closed on
Dec 11, 1997
Sold by
Miami Deco Ltd
Bought by
Shahinian John and Shahinian Kathy
Create a Home Valuation Report for This Property
The Home Valuation Report is an in-depth analysis detailing your home's value as well as a comparison with similar homes in the area
Home Values in the Area
Average Home Value in this Area
Purchase History
| Date | Buyer | Sale Price | Title Company |
|---|---|---|---|
| Antenucci Angelo | $237,500 | -- | |
| Castaneda Yvonne | $72,000 | -- | |
| Benedict Brian | -- | -- | |
| Shahinian John | $70,000 | -- |
Source: Public Records
Mortgage History
| Date | Status | Borrower | Loan Amount |
|---|---|---|---|
| Open | Antenucci Angelo | $180,000 | |
| Previous Owner | Castaneda Yvonne | $146,349 |
Source: Public Records
Tax History Compared to Growth
Tax History
| Year | Tax Paid | Tax Assessment Tax Assessment Total Assessment is a certain percentage of the fair market value that is determined by local assessors to be the total taxable value of land and additions on the property. | Land | Improvement |
|---|---|---|---|---|
| 2024 | $2,386 | $286,488 | -- | -- |
| 2023 | $2,386 | $167,380 | $0 | $0 |
| 2022 | $2,279 | $162,505 | $0 | $0 |
| 2021 | $2,478 | $169,276 | $0 | $0 |
| 2020 | $3,833 | $202,000 | $0 | $0 |
| 2019 | $3,619 | $202,000 | $0 | $0 |
| 2018 | $3,040 | $161,677 | $0 | $0 |
| 2017 | $3,619 | $183,018 | $0 | $0 |
| 2016 | $3,622 | $166,380 | $0 | $0 |
| 2015 | $3,517 | $151,255 | $0 | $0 |
| 2014 | $3,365 | $137,505 | $0 | $0 |
Source: Public Records
Map
Nearby Homes
- 1051 Euclid Ave Unit 208
- 1035 Euclid Ave Unit 18
- 1035 Euclid Ave Unit 25
- 1060 Pennsylvania Ave Unit 18
- 1050 Pennsylvania Ave Unit 24
- 1050 Pennsylvania Ave Unit 29
- 1050 Pennsylvania Ave Unit 11
- 1021 Euclid Ave Unit 1
- 1021 Euclid Ave Unit 3
- 1021 Euclid Ave Unit 12
- 1021 Euclid Ave Unit 5
- 1021 Euclid Ave Unit 8
- 1021 Euclid Ave Unit 10
- 1027 Euclid Ave Unit 5
- 1135 Euclid Ave Unit 104
- 1018 Euclid Ave Unit 2
- 1124 Pennsylvania Ave
- 1004 Pennsylvania Ave Unit 3
- 1150 Euclid Venue Unit 202
- 1051 Meridian Ave Unit 1D
- 1051 Euclid Ave Unit 207
- 1051 Euclid Ave Unit 107
- 1051 Euclid Ave Unit 110
- 1051 Euclid Ave Unit 109
- 1051 Euclid Ave Unit 209
- 1051 Euclid Ave Unit 210
- 1051 Euclid Ave Unit 108
- 1051 Euclid Ave Unit 208
- 1051 1051 Euclid Av # 207 Unit 207
- 1061 1061 Euclid Av # 201 Unit 201
- 1061 Euclid Ave Unit 201
- 1061 Euclid Ave Unit 106
- 1061 Euclid Ave Unit 202
- 1061 Euclid Ave Unit 101
- 1061 Euclid Ave Unit 104
- 1061 Euclid Ave Unit 103
- 1061 Euclid Ave Unit 102
- 1061 Euclid Ave Unit 105
- 1061 Euclid Ave Unit 203
- 1061 Euclid Ave Unit 205