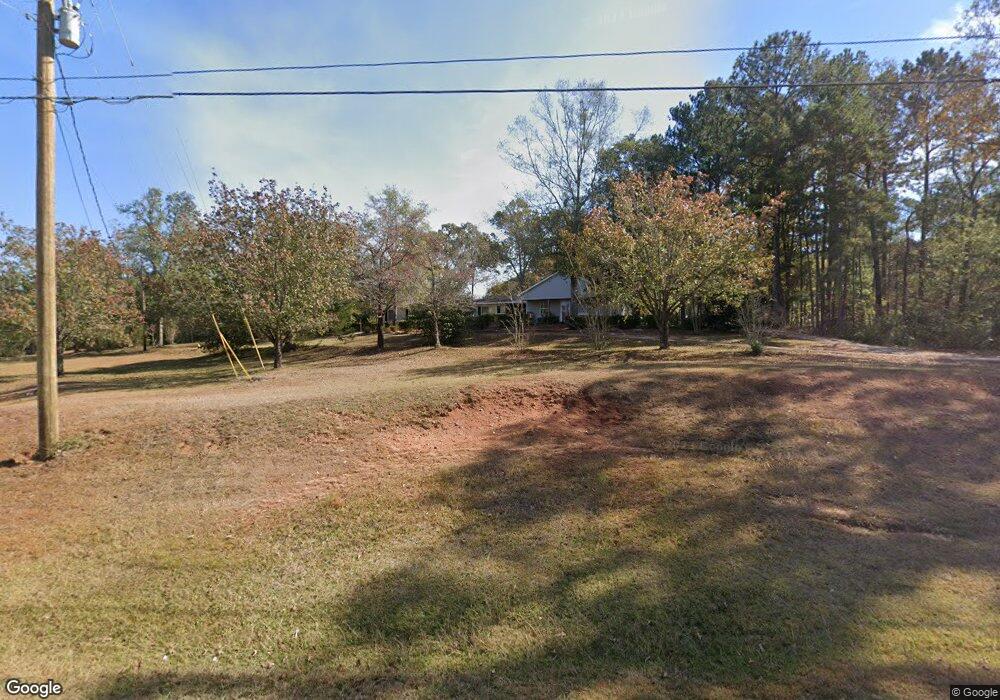
1051 Wares Cross Rd Lagrange, GA 30240
Estimated Value: $282,000 - $337,526
3
Beds
1
Bath
1,698
Sq Ft
$178/Sq Ft
Est. Value
About This Home
This home is located at 1051 Wares Cross Rd, Lagrange, GA 30240 and is currently estimated at $302,632, approximately $178 per square foot. 1051 Wares Cross Rd is a home located in Troup County with nearby schools including Hillcrest Elementary School, Franklin Forest Elementary School, and Hollis Hand Elementary School.
Ownership History
Date
Name
Owned For
Owner Type
Purchase Details
Closed on
Dec 10, 2020
Sold by
Upward Properties Management Llc
Bought by
Carey Teresa Dawn and Carey Christopher Dean
Current Estimated Value
Home Financials for this Owner
Home Financials are based on the most recent Mortgage that was taken out on this home.
Original Mortgage
$162,011
Outstanding Balance
$144,495
Interest Rate
2.8%
Mortgage Type
FHA
Estimated Equity
$158,137
Purchase Details
Closed on
Apr 18, 2018
Sold by
Morgan Foster S
Bought by
Upward Properties Management L
Home Financials for this Owner
Home Financials are based on the most recent Mortgage that was taken out on this home.
Original Mortgage
$102,499
Interest Rate
4.45%
Mortgage Type
Purchase Money Mortgage
Purchase Details
Closed on
Dec 30, 2016
Sold by
Debra
Bought by
Morgan Foster S and Foster Marianne W
Purchase Details
Closed on
Feb 26, 1990
Bought by
Debra Cato Foster
Purchase Details
Closed on
Jan 1, 1971
Purchase Details
Closed on
Jan 1, 1959
Create a Home Valuation Report for This Property
The Home Valuation Report is an in-depth analysis detailing your home's value as well as a comparison with similar homes in the area
Home Values in the Area
Average Home Value in this Area
Purchase History
| Date | Buyer | Sale Price | Title Company |
|---|---|---|---|
| Carey Teresa Dawn | $165,000 | -- | |
| Upward Properties Management L | -- | -- | |
| Morgan Foster S | -- | -- | |
| Debra Cato Foster | -- | -- | |
| -- | -- | -- | |
| -- | -- | -- |
Source: Public Records
Mortgage History
| Date | Status | Borrower | Loan Amount |
|---|---|---|---|
| Open | Carey Teresa Dawn | $162,011 | |
| Previous Owner | Upward Properties Management L | $102,499 |
Source: Public Records
Tax History Compared to Growth
Tax History
| Year | Tax Paid | Tax Assessment Tax Assessment Total Assessment is a certain percentage of the fair market value that is determined by local assessors to be the total taxable value of land and additions on the property. | Land | Improvement |
|---|---|---|---|---|
| 2024 | $3,167 | $118,120 | $16,560 | $101,560 |
| 2023 | $3,087 | $113,200 | $16,560 | $96,640 |
| 2022 | $1,839 | $65,880 | $16,560 | $49,320 |
| 2021 | $1,972 | $65,400 | $16,360 | $49,040 |
| 2020 | $1,328 | $44,016 | $16,360 | $27,656 |
| 2019 | $1,332 | $44,176 | $16,360 | $27,816 |
| 2018 | $944 | $31,296 | $16,360 | $14,936 |
| 2017 | $884 | $29,296 | $16,360 | $12,936 |
| 2016 | $1,033 | $34,234 | $6,000 | $28,234 |
| 2015 | $1,034 | $34,234 | $6,000 | $28,234 |
| 2014 | $991 | $32,748 | $6,000 | $26,748 |
| 2013 | -- | $34,238 | $6,000 | $28,238 |
Source: Public Records
Map
Nearby Homes
- 1006 Wares Cross Rd
- 219 E Yorktown Dr
- 206 Sturbridge Dr
- 3011 Mooty Bridge Rd
- 223 Village Dr
- 0 Waterview Dr Unit LOT 34 10500921
- 0 Waterview Dr Unit LOT 37 & 27B
- 0 Waterview Dr Unit 10580887
- 0 Waterview Dr Unit LOT 31 10491353
- 0 Waterview Dr Unit LOT 30 10491028
- 0 Waterview Dr Unit 10554814
- 0 Waterview Dr Unit 10558462
- 135 Edgemont Dr Unit LOT 2
- 114 Taylor Len Dr
- 160 Lakemont Dr
- 57 Hubbard Rd
- 305 Edgemont Dr
- 24 N Brooks Rd
- 107 Cameron Pointe Dr
- 102 Plantation Ct
- 1017 Wares Cross Rd
- 1070 Wares Cross Rd
- 1087 Wares Cross Rd
- 1030 Wares Cross Rd
- 1030 Wares Cross Rd
- 1044 Wares Cross Rd
- 1107 Wares Cross Rd
- 1110 Wares Cross Rd
- 982 Wares Cross Rd
- 1141 Wares Cross Rd
- 937 Wares Cross Rd
- 1142 Wares Cross Rd
- 940 Wares Cross Rd
- 109 Copper Creek Dr
- 1153 Wares Cross Rd
- 958 Wares Cross Rd
- 105 Copper Creek Dr
- 1170 Wares Cross Rd
- 920 Wares Cross Rd
- 111 Copper Creek Dr