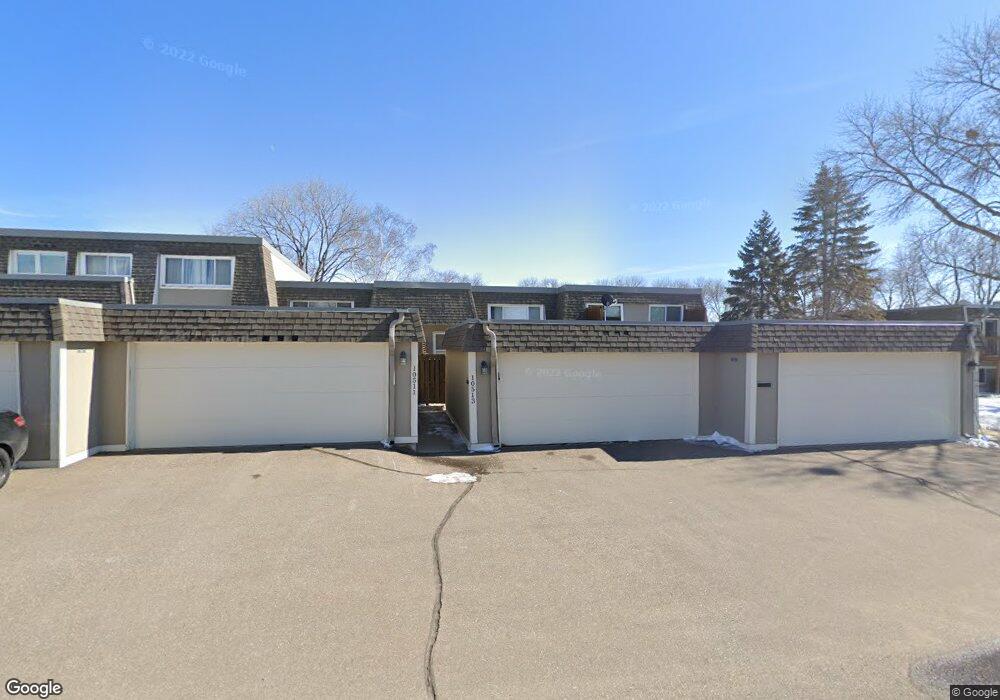
10513 Dupont Rd S Minneapolis, MN 55431
West Bloomington NeighborhoodEstimated Value: $247,000 - $254,000
3
Beds
2
Baths
880
Sq Ft
$284/Sq Ft
Est. Value
About This Home
This home is located at 10513 Dupont Rd S, Minneapolis, MN 55431 and is currently estimated at $249,905, approximately $283 per square foot. 10513 Dupont Rd S is a home located in Hennepin County with nearby schools including Oak Grove Elementary School, Oak Grove Middle School, and Kennedy Senior High School.
Ownership History
Date
Name
Owned For
Owner Type
Purchase Details
Closed on
Nov 20, 2015
Bought by
Guzman Ruben Ruben
Current Estimated Value
Home Financials for this Owner
Home Financials are based on the most recent Mortgage that was taken out on this home.
Original Mortgage
$164,000
Outstanding Balance
$129,777
Interest Rate
3.97%
Estimated Equity
$120,128
Purchase Details
Closed on
Oct 21, 2014
Sold by
Malmanger Wayne C
Bought by
Oak Grove Terrace Association
Purchase Details
Closed on
Mar 20, 2009
Sold by
Mchomvu Dius B and Mchomvu Jessica
Bought by
Malmanger Wanye C
Purchase Details
Closed on
Mar 17, 2006
Sold by
Pajak Sean and Pajak Carolyn
Bought by
Mchomvu Pius and Mchomvu Jessica
Purchase Details
Closed on
Jul 30, 2001
Sold by
Eide Dale E
Bought by
Certified Mtg Investment Co
Create a Home Valuation Report for This Property
The Home Valuation Report is an in-depth analysis detailing your home's value as well as a comparison with similar homes in the area
Home Values in the Area
Average Home Value in this Area
Purchase History
| Date | Buyer | Sale Price | Title Company |
|---|---|---|---|
| Guzman Ruben Ruben | $164,000 | -- | |
| Oak Grove Terrace Association | $11,153 | None Available | |
| Malmanger Wanye C | $98,650 | -- | |
| Mchomvu Pius | $165,000 | -- | |
| Certified Mtg Investment Co | $120,000 | -- | |
| Pajak Sean R | $132,100 | -- |
Source: Public Records
Mortgage History
| Date | Status | Borrower | Loan Amount |
|---|---|---|---|
| Open | Guzman Ruben Ruben | $164,000 |
Source: Public Records
Tax History Compared to Growth
Tax History
| Year | Tax Paid | Tax Assessment Tax Assessment Total Assessment is a certain percentage of the fair market value that is determined by local assessors to be the total taxable value of land and additions on the property. | Land | Improvement |
|---|---|---|---|---|
| 2024 | $2,558 | $219,700 | $31,800 | $187,900 |
| 2023 | $2,407 | $214,700 | $31,800 | $182,900 |
| 2022 | $2,161 | $227,100 | $31,800 | $195,300 |
| 2021 | $2,118 | $185,900 | $30,700 | $155,200 |
| 2020 | $2,050 | $181,700 | $30,300 | $151,400 |
| 2019 | $2,077 | $172,400 | $30,300 | $142,100 |
| 2018 | $1,895 | $171,400 | $29,500 | $141,900 |
| 2017 | $1,668 | $140,800 | $26,300 | $114,500 |
| 2016 | $1,231 | $106,900 | $25,500 | $81,400 |
| 2015 | $1,639 | $106,600 | $25,200 | $81,400 |
| 2014 | -- | $106,800 | $24,900 | $81,900 |
Source: Public Records
Map
Nearby Homes
- 1005 W 104th St
- 10610 Humboldt Ave S
- 2113 Village Terrace
- 2225 Village Terrace
- 9824 Fremont Ave S
- 10633 Russell Ave S
- 9852 Blaisdell Ave S
- 11000 Queen Ave S
- 601 E 103rd St
- 9522 Pleasant Ave S
- 10524 Xerxes Ave S
- 10212 Xerxes Ave S
- 3213 W Old Shakopee Rd
- 9700 Portland Ave S Unit 237
- 9700 Portland Ave S Unit 332
- 9600 Clinton Ave S
- 2300 W 95th St
- 10325 10th Avenue Cir S
- 9600 Portland Ave S Unit 107
- 9600 Portland Ave S Unit 109
- 10515 Dupont Rd S
- 10511 Dupont Rd S
- 10509 Dupont Rd S
- 10507 Dupont Rd S
- 10505 Dupont Rd S
- 10531 Dupont Rd S
- 10503 Dupont Rd S
- 10533 Dupont Rd S
- 10501 Dupont Rd S
- 10506 W Bloomington Fwy
- 10504 W Bloomington Fwy
- 10508 W Bloomington Fwy
- 10500 W Bloomington Fwy
- 10502 W Bloomington Fwy
- 10537 Dupont Rd S
- 10510 W Bloomington Fwy
- 1011 W 105th St
- 10512 W Bloomington Fwy
- 1009 W 105th St
- 10539 Dupont Rd S