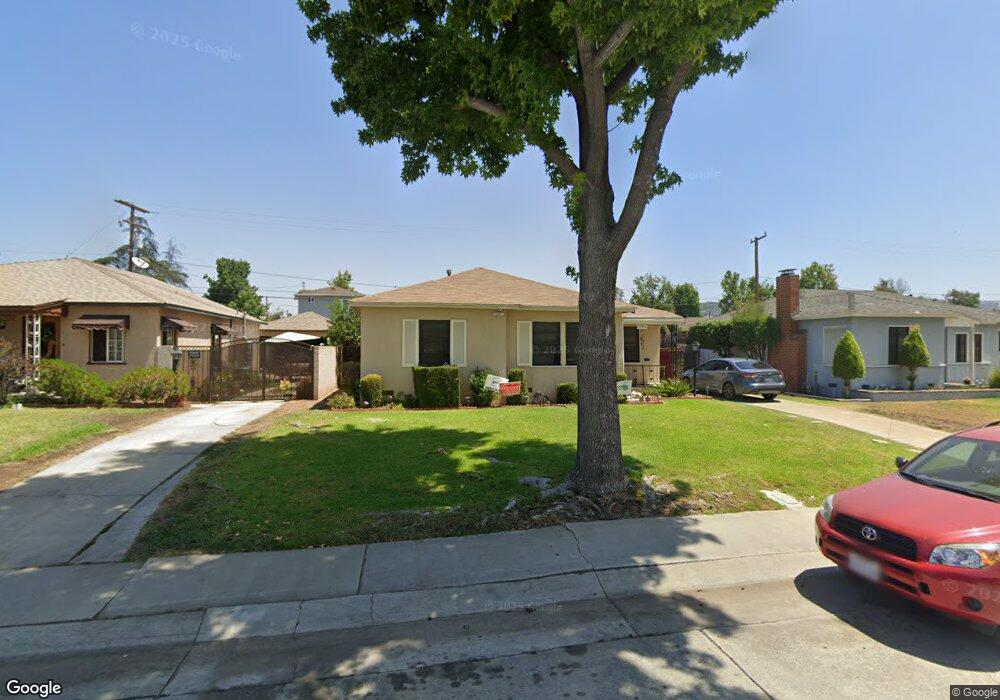
10513 Rose Dr Whittier, CA 90606
West Whittier NeighborhoodEstimated Value: $693,193 - $766,000
2
Beds
1
Bath
950
Sq Ft
$774/Sq Ft
Est. Value
About This Home
This home is located at 10513 Rose Dr, Whittier, CA 90606 and is currently estimated at $735,048, approximately $773 per square foot. 10513 Rose Dr is a home located in Los Angeles County with nearby schools including Orange Grove Elementary School, Walter F. Dexter Middle School, and Whittier High School.
Ownership History
Date
Name
Owned For
Owner Type
Purchase Details
Closed on
Feb 15, 2017
Sold by
Hosford Douglas Gene
Bought by
Hosford Douglas Gene and Hosford Trust
Current Estimated Value
Purchase Details
Closed on
Aug 19, 2011
Sold by
Cook Cynthia Jane
Bought by
Cook Cynthia J and Cynthia J Cook 2011 Separate Property Tr
Purchase Details
Closed on
Jan 23, 2007
Sold by
Hosford David S and Donall Gene Hosford Separate P
Bought by
Cook Cynthia Jane
Purchase Details
Closed on
Apr 30, 2003
Sold by
Hosford Donall Gene
Bought by
Hosford Donall Gene and Donall Gene Hosford Separate Property Tr
Purchase Details
Closed on
Mar 4, 2003
Sold by
Orr Donna M and Hosford 2001 Revocab Mildred M
Bought by
Cook Cynthia Jane
Purchase Details
Closed on
Jun 6, 2002
Sold by
Hosford Donald G and Hosford Mildred M
Bought by
Hosford Donald G
Purchase Details
Closed on
Jun 3, 2002
Sold by
Hosford Mildred M
Bought by
Hosford Mildred M and Mildred M Hosford 2001 Revocable Trust
Create a Home Valuation Report for This Property
The Home Valuation Report is an in-depth analysis detailing your home's value as well as a comparison with similar homes in the area
Home Values in the Area
Average Home Value in this Area
Purchase History
| Date | Buyer | Sale Price | Title Company |
|---|---|---|---|
| Hosford Douglas Gene | -- | None Available | |
| Cook Cynthia J | -- | None Available | |
| Cook Cynthia Jane | -- | None Available | |
| Hosford Donall Gene | -- | -- | |
| Cook Cynthia Jane | -- | -- | |
| Hosford Donald G | -- | -- | |
| Hosford Mildred M | -- | -- |
Source: Public Records
Tax History Compared to Growth
Tax History
| Year | Tax Paid | Tax Assessment Tax Assessment Total Assessment is a certain percentage of the fair market value that is determined by local assessors to be the total taxable value of land and additions on the property. | Land | Improvement |
|---|---|---|---|---|
| 2025 | $3,953 | $293,959 | $217,150 | $76,809 |
| 2024 | $3,953 | $288,196 | $212,893 | $75,303 |
| 2023 | $3,902 | $282,546 | $208,719 | $73,827 |
| 2022 | $3,830 | $277,007 | $204,627 | $72,380 |
| 2021 | $3,742 | $271,576 | $200,615 | $70,961 |
| 2020 | $3,676 | $268,792 | $198,558 | $70,234 |
| 2019 | $3,681 | $263,522 | $194,665 | $68,857 |
| 2018 | $3,505 | $258,356 | $190,849 | $67,507 |
| 2016 | $3,348 | $248,326 | $183,439 | $64,887 |
| 2015 | $3,271 | $244,597 | $180,684 | $63,913 |
| 2014 | $3,206 | $239,807 | $177,145 | $62,662 |
Source: Public Records
Map
Nearby Homes
- 5903 Redman Ave
- 5518 Norwalk Blvd
- 11302 Maple St
- 10050 Obregon St
- 5593 Pioneer Blvd Unit 18
- 5729 Juarez Ave
- 5577 Pioneer Blvd Unit 5
- 10013 Obregon St
- 10825 Loch Avon Dr
- 5315 Bihr Ct
- 11511 Beverly Dr
- 5307 Woodward Ln
- 11232 Dorland Dr
- 10605 Cordoba Ct
- 11273 Dorland Dr
- 10943 Loch Lomond Dr
- 5115 Castelotte Ct
- 5107 Vista Verde Way
- 11447 Broadway Ave
- 6225 Gretna Ave