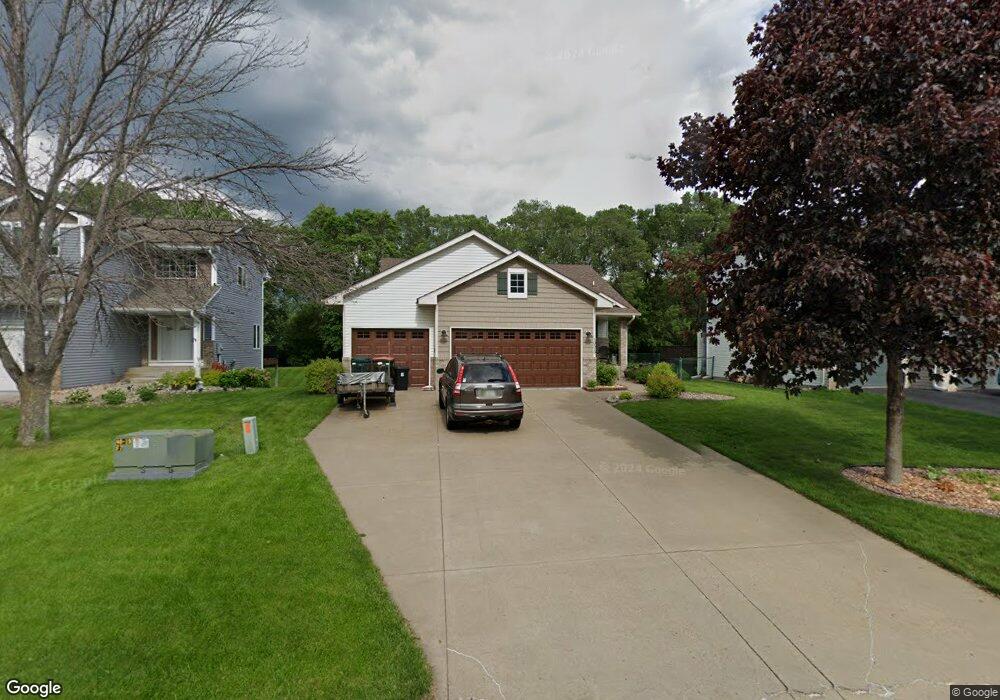
10519 Able St NE Minneapolis, MN 55434
Estimated Value: $411,000 - $442,000
4
Beds
3
Baths
1,282
Sq Ft
$335/Sq Ft
Est. Value
About This Home
This home is located at 10519 Able St NE, Minneapolis, MN 55434 and is currently estimated at $428,963, approximately $334 per square foot. 10519 Able St NE is a home located in Anoka County with nearby schools including Madison Elementary School, Northdale Middle School, and Blaine Senior High School.
Ownership History
Date
Name
Owned For
Owner Type
Purchase Details
Closed on
Nov 17, 2010
Sold by
Morton Scott A and Morton Rachael M
Bought by
Hiti Michael T and Greenquist Josephine C
Current Estimated Value
Home Financials for this Owner
Home Financials are based on the most recent Mortgage that was taken out on this home.
Original Mortgage
$242,200
Outstanding Balance
$159,637
Interest Rate
4.25%
Mortgage Type
FHA
Estimated Equity
$269,326
Purchase Details
Closed on
Mar 21, 2002
Sold by
Pilot Land Development Company
Bought by
Morton Rachel M and Morton Scott A
Create a Home Valuation Report for This Property
The Home Valuation Report is an in-depth analysis detailing your home's value as well as a comparison with similar homes in the area
Home Values in the Area
Average Home Value in this Area
Purchase History
| Date | Buyer | Sale Price | Title Company |
|---|---|---|---|
| Hiti Michael T | $248,500 | -- | |
| Morton Rachel M | $202,371 | -- |
Source: Public Records
Mortgage History
| Date | Status | Borrower | Loan Amount |
|---|---|---|---|
| Open | Hiti Michael T | $242,200 |
Source: Public Records
Tax History Compared to Growth
Tax History
| Year | Tax Paid | Tax Assessment Tax Assessment Total Assessment is a certain percentage of the fair market value that is determined by local assessors to be the total taxable value of land and additions on the property. | Land | Improvement |
|---|---|---|---|---|
| 2025 | $4,251 | $410,600 | $110,000 | $300,600 |
| 2024 | $4,251 | $404,300 | $108,200 | $296,100 |
| 2023 | $3,881 | $405,000 | $103,000 | $302,000 |
| 2022 | $3,612 | $404,900 | $90,000 | $314,900 |
| 2021 | $3,530 | $336,300 | $75,000 | $261,300 |
| 2020 | $3,284 | $321,900 | $75,000 | $246,900 |
| 2019 | $3,087 | $290,500 | $67,000 | $223,500 |
| 2018 | $2,977 | $268,700 | $0 | $0 |
| 2017 | $2,712 | $254,000 | $0 | $0 |
| 2016 | $2,782 | $232,500 | $0 | $0 |
| 2015 | $2,767 | $232,500 | $64,700 | $167,800 |
| 2014 | -- | $197,700 | $52,000 | $145,700 |
Source: Public Records
Map
Nearby Homes
- 10301 Fillmore Place
- 10809 Tyler Ct NE
- 10753 Tyler Ct NE
- 1312 104th Place NE
- 10721 Quincy Blvd NE
- 1348 104th Way
- 714 114th Ct NE
- 10252 Jackson St NE
- 1060 109th Ct NE
- 1131 101st Ave NE Unit B
- 11038 Polk St NE
- 782 101st Ave NE
- 10007 Tyler St NE
- 10022 Fillmore St NE Unit 72
- 10000 Fillmore St NE Unit 66
- 612 111th Ave NE
- 9926 Fillmore St NE
- 10570 President Dr NE
- 11213 Fillmore St NE
- 11119 Jefferson St NE
- 10525 Able St NE
- 10513 Able St NE
- 10509 Able St NE
- 10531 Able St NE
- 10537 Able St NE
- 10520 Able St NE
- 10503 Able St NE
- 10514 Able St NE
- 10526 Able St NE
- 10508 Able St NE
- 10502 Able St NE
- 10546 Able St NE
- 10545 Able St NE
- 10554 Able St NE
- 984 105th Ave NE
- 10549 Van Buren Cir NE
- 972 105th Ave NE
- 960 105th Ave NE
- 10547 Van Buren Cir NE
- 10551 Van Buren Cir NE