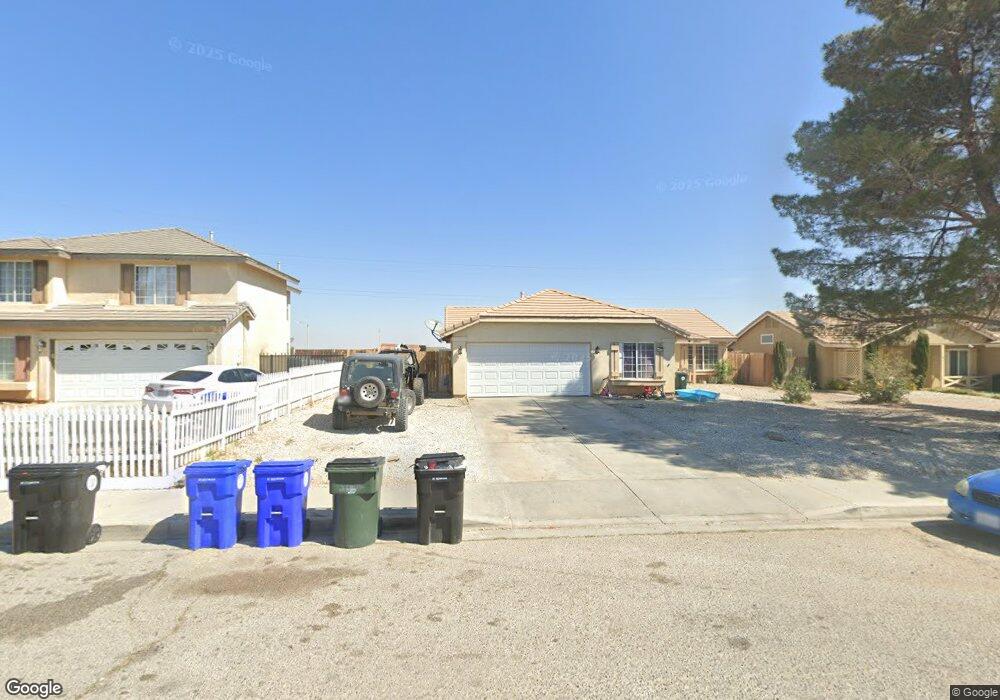
10522 Arlington St Adelanto, CA 92301
Mesa Linda NeighborhoodEstimated Value: $375,970 - $415,000
3
Beds
2
Baths
1,610
Sq Ft
$248/Sq Ft
Est. Value
About This Home
This home is located at 10522 Arlington St, Adelanto, CA 92301 and is currently estimated at $399,493, approximately $248 per square foot. 10522 Arlington St is a home located in San Bernardino County with nearby schools including Theodore Vick Elementary School, Columbia Middle School, and Adelanto High School.
Ownership History
Date
Name
Owned For
Owner Type
Purchase Details
Closed on
Aug 31, 2004
Sold by
Tabor Lee W
Bought by
Tabor Lee Whit and Tabor Elizabeth Kay
Current Estimated Value
Purchase Details
Closed on
Aug 16, 1999
Sold by
Hud
Bought by
Tabor Lee W and Tabor Elizabeth K
Home Financials for this Owner
Home Financials are based on the most recent Mortgage that was taken out on this home.
Original Mortgage
$50,550
Outstanding Balance
$14,799
Interest Rate
7.89%
Estimated Equity
$384,694
Purchase Details
Closed on
May 20, 1999
Sold by
Ge Capital Mtg Services Inc
Bought by
Hud
Purchase Details
Closed on
Apr 30, 1999
Sold by
Randall Kenneth J
Bought by
G E Capital Mtg Services Inc
Purchase Details
Closed on
Jun 16, 1994
Sold by
West Venture
Bought by
Randall Kenneth J and Randall Melody L
Home Financials for this Owner
Home Financials are based on the most recent Mortgage that was taken out on this home.
Original Mortgage
$91,419
Interest Rate
8.53%
Mortgage Type
FHA
Create a Home Valuation Report for This Property
The Home Valuation Report is an in-depth analysis detailing your home's value as well as a comparison with similar homes in the area
Home Values in the Area
Average Home Value in this Area
Purchase History
| Date | Buyer | Sale Price | Title Company |
|---|---|---|---|
| Tabor Lee Whit | -- | -- | |
| Tabor Lee W | $63,500 | Universal Title Company | |
| Hud | -- | Benefit Land Title Ins Co | |
| G E Capital Mtg Services Inc | $102,147 | Benefit Land Title Ins Co | |
| Randall Kenneth J | $92,000 | Continental Lawyers Title Co |
Source: Public Records
Mortgage History
| Date | Status | Borrower | Loan Amount |
|---|---|---|---|
| Open | Tabor Lee W | $50,550 | |
| Previous Owner | Randall Kenneth J | $91,419 |
Source: Public Records
Tax History Compared to Growth
Tax History
| Year | Tax Paid | Tax Assessment Tax Assessment Total Assessment is a certain percentage of the fair market value that is determined by local assessors to be the total taxable value of land and additions on the property. | Land | Improvement |
|---|---|---|---|---|
| 2025 | $1,756 | $107,589 | $23,053 | $84,536 |
| 2024 | $1,756 | $105,479 | $22,601 | $82,878 |
| 2023 | $1,786 | $103,411 | $22,158 | $81,253 |
| 2022 | $1,669 | $101,384 | $21,724 | $79,660 |
| 2021 | $1,617 | $99,396 | $21,298 | $78,098 |
| 2020 | $1,573 | $98,377 | $21,080 | $77,297 |
| 2019 | $1,557 | $96,448 | $20,667 | $75,781 |
| 2018 | $1,551 | $94,557 | $20,262 | $74,295 |
| 2017 | $1,500 | $92,703 | $19,865 | $72,838 |
| 2016 | $1,471 | $90,885 | $19,475 | $71,410 |
| 2015 | $1,409 | $89,519 | $19,182 | $70,337 |
| 2014 | $1,407 | $87,765 | $18,806 | $68,959 |
Source: Public Records
Map
Nearby Homes
- 0 Cypress Rd
- 10580 Wakefield St E
- 14820 Redwood St
- 10695 Plainfield St
- 10776 Tolliver St
- 10770 Plainfield St
- 0 Villa St Unit HD24042825
- 14551 Heatherdale Ct
- 14827 Kimberly St
- 14543 Handsdale St
- 10736 Dove Ct
- 10912 Pershing Dr
- 15182 Amber Way
- 14990 Coppola St
- 10886 Thorndale St
- 10654 Alton Place
- 0 Aster Rd Unit PW25108642
- 0 Aster Rd Unit HD25042164
- 0 Aster Rd Unit CV24252543
- 0 Aster Rd Unit SR24238014
- 10532 Arlington St
- 10510 Arlington St
- 10544 Arlington St
- 10517 Arlington St
- 10527 Arlington St
- 10509 Arlington St
- 10554 Arlington St
- 10537 Arlington St
- 10547 Arlington St
- 10564 Arlington St
- 10522 Cascade Ct
- 10528 Cascade Ct
- 10538 Cascade Ct
- 10576 Arlington St
- 10514 Cascade Ct
- 10548 Cascade Ct
- 10543 Wakefield St E
- 14815 Providence Rd
- 10586 Arlington St
- 10545 Wakefield St E