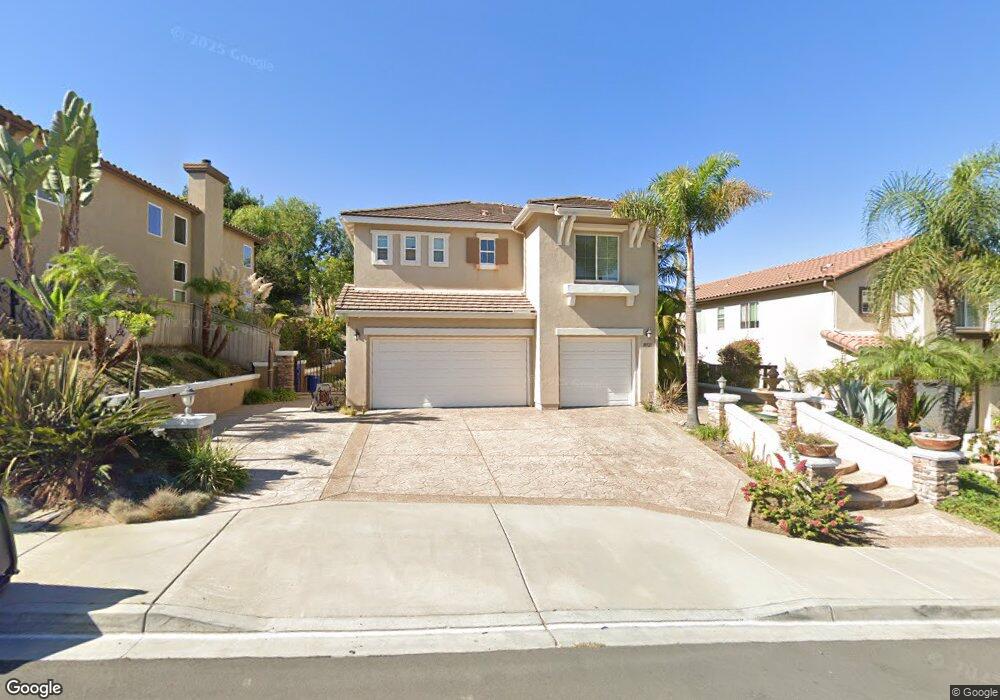
10527 Stony Ridge Way Unit 4 San Diego, CA 92131
Miramar Ranch North NeighborhoodEstimated Value: $2,163,365 - $2,438,000
5
Beds
5
Baths
3,381
Sq Ft
$669/Sq Ft
Est. Value
About This Home
This home is located at 10527 Stony Ridge Way Unit 4, San Diego, CA 92131 and is currently estimated at $2,261,841, approximately $668 per square foot. 10527 Stony Ridge Way Unit 4 is a home located in San Diego County with nearby schools including Miramar Ranch Elementary School, Thurgood Marshall Middle School, and Scripps Ranch High School.
Ownership History
Date
Name
Owned For
Owner Type
Purchase Details
Closed on
Aug 21, 2023
Sold by
Tang Cheng-Yu and Tang Genevieve
Bought by
Rouleau-Tang Family Trust and Tang
Current Estimated Value
Purchase Details
Closed on
Jul 22, 2013
Sold by
Tu Ngoc Diep
Bought by
Tang Cheng Yu and Rouleau Genevieve
Home Financials for this Owner
Home Financials are based on the most recent Mortgage that was taken out on this home.
Original Mortgage
$417,000
Interest Rate
4.36%
Mortgage Type
New Conventional
Purchase Details
Closed on
Jun 28, 2004
Sold by
Tu Ngoc Diep
Bought by
Tu Ngoc Diep
Purchase Details
Closed on
Aug 1, 2003
Sold by
Shea Homes Inc
Bought by
Tu Ngoc Diep
Home Financials for this Owner
Home Financials are based on the most recent Mortgage that was taken out on this home.
Original Mortgage
$559,100
Interest Rate
4.25%
Mortgage Type
New Conventional
Create a Home Valuation Report for This Property
The Home Valuation Report is an in-depth analysis detailing your home's value as well as a comparison with similar homes in the area
Home Values in the Area
Average Home Value in this Area
Purchase History
| Date | Buyer | Sale Price | Title Company |
|---|---|---|---|
| Rouleau-Tang Family Trust | -- | None Listed On Document | |
| Tang Cheng Yu | $870,000 | Corinthian Title Company | |
| Tu Ngoc Diep | -- | -- | |
| Tu Ngoc Diep | $699,000 | First American Title Co |
Source: Public Records
Mortgage History
| Date | Status | Borrower | Loan Amount |
|---|---|---|---|
| Previous Owner | Tang Cheng Yu | $417,000 | |
| Previous Owner | Tu Ngoc Diep | $559,100 |
Source: Public Records
Tax History Compared to Growth
Tax History
| Year | Tax Paid | Tax Assessment Tax Assessment Total Assessment is a certain percentage of the fair market value that is determined by local assessors to be the total taxable value of land and additions on the property. | Land | Improvement |
|---|---|---|---|---|
| 2025 | $13,259 | $1,066,490 | $284,539 | $781,951 |
| 2024 | $13,259 | $1,045,579 | $278,960 | $766,619 |
| 2023 | $12,957 | $1,025,079 | $273,491 | $751,588 |
| 2022 | $12,549 | $1,004,980 | $268,129 | $736,851 |
| 2021 | $12,452 | $985,275 | $262,872 | $722,403 |
| 2020 | $12,304 | $975,173 | $260,177 | $714,996 |
| 2019 | $12,064 | $956,053 | $255,076 | $700,977 |
| 2018 | $11,272 | $937,308 | $250,075 | $687,233 |
| 2017 | $11,010 | $918,930 | $245,172 | $673,758 |
| 2016 | $10,839 | $900,913 | $240,365 | $660,548 |
| 2015 | $10,683 | $887,381 | $236,755 | $650,626 |
| 2014 | $10,518 | $870,000 | $232,118 | $637,882 |
Source: Public Records
Map
Nearby Homes
- 11482 Cortina Place
- 11365 Affinity Ct Unit 192
- 9960 Scripps Vista Way Unit 116
- 11215 Affinity Ct Unit 80
- 11265 Affinity Ct Unit 103
- 11175 Affinity Ct Unit 45
- 11235 Affinity Ct Unit 68
- 11325 Affinity Ct Unit 151
- 10818 Caminito Arcada
- 11115 Affinity Ct Unit 1
- 10941 Waterton Rd
- 11856 Miro Cir
- 11825 Miro Cir
- 9909 Scripps Westview Way Unit 212
- 9899 Scripps Westview Way Unit 243
- 9899 Scripps Westview Way Unit 244
- 10914 Ivy Hill Dr Unit 1
- 9929 Erma Rd Unit 102
- 9939 Erma Rd Unit 101
- 9959 Erma Rd Unit 104
- 10521 Stony Ridge Way
- 10533 Stony Ridge Way
- 10543 Stony Ridge Way Unit 4
- 10515 Stony Ridge Way
- 10446 Mckinney Ct
- 10504 Stony Ridge Ct
- 11657 Winding Ridge Dr
- 10549 Stony Ridge Way Unit 4
- 11651 Winding Ridge Dr
- 10509 Stony Ridge Way
- 10440 Mckinney Ct
- 11665 Winding Ridge Dr
- 10510 Stony Ridge Ct Unit 4
- 10555 Stony Ridge Way
- 10505 Stony Ridge Ct Unit 4
- 11671 Winding Ridge Dr
- 11645 Winding Ridge Dr
- 10434 Mckinney Ct Unit 5
- 10503 Stony Ridge Way Unit 4
- 10516 Stony Ridge Ct Unit 4