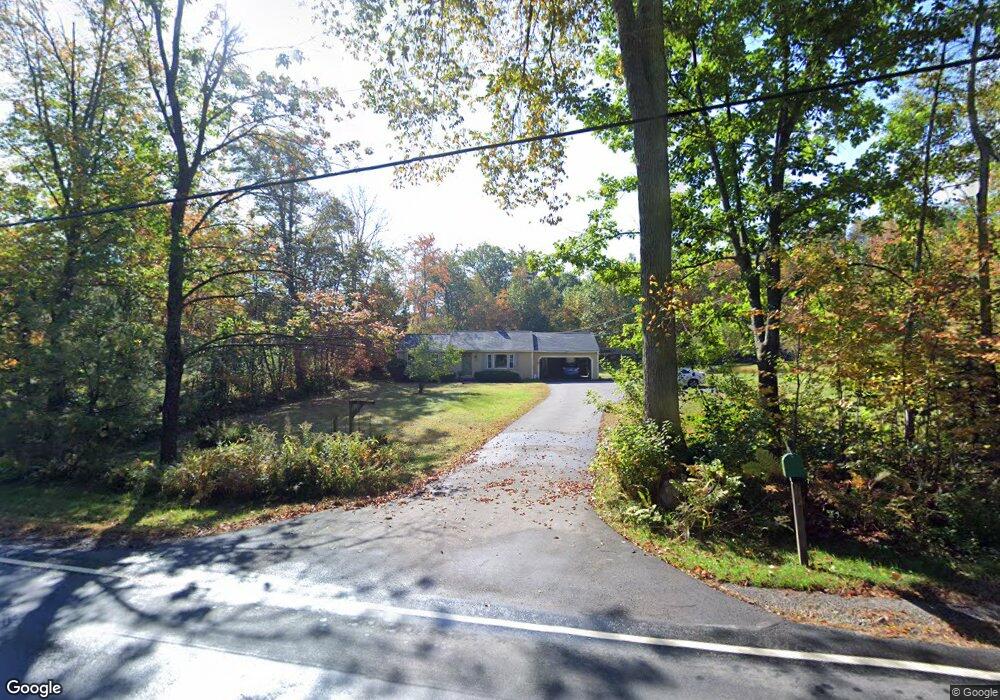
1053 Forest Rd Greenfield, NH 03047
Greenfield NeighborhoodEstimated Value: $412,000 - $449,400
3
Beds
1
Bath
1,386
Sq Ft
$308/Sq Ft
Est. Value
About This Home
This home is located at 1053 Forest Rd, Greenfield, NH 03047 and is currently estimated at $426,850, approximately $307 per square foot. 1053 Forest Rd is a home located in Hillsborough County with nearby schools including Greenfield Elementary School, South Meadow School, and Conval Regional High School.
Ownership History
Date
Name
Owned For
Owner Type
Purchase Details
Closed on
Jul 17, 2024
Sold by
Thompson Daniel J and Thompson Lauri A
Bought by
Hemenway Simon and Hemenway Jillian
Current Estimated Value
Home Financials for this Owner
Home Financials are based on the most recent Mortgage that was taken out on this home.
Original Mortgage
$330,000
Outstanding Balance
$326,058
Interest Rate
6.99%
Mortgage Type
Purchase Money Mortgage
Estimated Equity
$100,792
Purchase Details
Closed on
Aug 23, 2007
Sold by
Mirabella Angelo O and Mirabella Lillian P
Bought by
Thompson Daniel J and Thompson Lauri A
Home Financials for this Owner
Home Financials are based on the most recent Mortgage that was taken out on this home.
Original Mortgage
$178,900
Interest Rate
6.78%
Mortgage Type
Purchase Money Mortgage
Purchase Details
Closed on
Nov 20, 2002
Sold by
Cottle Brian R and Cottle Kristen T
Bought by
Mirabella Angelo O and Mirabella Lillian P
Purchase Details
Closed on
Aug 2, 2001
Sold by
Sullivan Kelly M
Bought by
Cottle Brian R and Cottle Kristen T
Create a Home Valuation Report for This Property
The Home Valuation Report is an in-depth analysis detailing your home's value as well as a comparison with similar homes in the area
Home Values in the Area
Average Home Value in this Area
Purchase History
| Date | Buyer | Sale Price | Title Company |
|---|---|---|---|
| Hemenway Simon | $380,000 | None Available | |
| Hemenway Simon | $380,000 | None Available | |
| Thompson Daniel J | $238,900 | -- | |
| Mirabella Angelo O | $165,000 | -- | |
| Cottle Brian R | $141,900 | -- | |
| Thompson Daniel J | $238,900 | -- | |
| Mirabella Angelo O | $165,000 | -- | |
| Cottle Brian R | $141,900 | -- |
Source: Public Records
Mortgage History
| Date | Status | Borrower | Loan Amount |
|---|---|---|---|
| Open | Hemenway Simon | $330,000 | |
| Closed | Hemenway Simon | $330,000 | |
| Previous Owner | Cottle Brian R | $181,800 | |
| Previous Owner | Cottle Brian R | $178,900 |
Source: Public Records
Tax History Compared to Growth
Tax History
| Year | Tax Paid | Tax Assessment Tax Assessment Total Assessment is a certain percentage of the fair market value that is determined by local assessors to be the total taxable value of land and additions on the property. | Land | Improvement |
|---|---|---|---|---|
| 2024 | $8,575 | $385,400 | $130,700 | $254,700 |
| 2023 | $7,126 | $210,200 | $76,900 | $133,300 |
| 2022 | $6,394 | $210,200 | $76,900 | $133,300 |
| 2021 | $5,633 | $210,200 | $76,900 | $133,300 |
| 2020 | $5,707 | $210,200 | $76,900 | $133,300 |
| 2019 | $5,732 | $210,200 | $76,900 | $133,300 |
| 2018 | $5,284 | $172,000 | $60,000 | $112,000 |
| 2017 | $5,086 | $169,700 | $60,000 | $109,700 |
| 2016 | $4,791 | $169,700 | $60,000 | $109,700 |
| 2015 | $4,711 | $169,700 | $60,000 | $109,700 |
| 2014 | $4,519 | $169,700 | $60,000 | $109,700 |
| 2013 | $4,894 | $201,500 | $76,300 | $125,200 |
Source: Public Records
Map
Nearby Homes
- 91 Swamp Rd
- 21 Sunset Lake Rd
- 25 Sunset Lake Rd
- 1388 Forest Rd
- 494 Old Bennington Rd
- 548 Old Bennington Rd
- 42 East Rd
- 21 Burke Rd
- 3 Ice House Ln
- 106 Zephyr Lake Rd
- 76 Gould Hill Rd
- R5-20-1 266 Francestown Rd
- 52 Dodge Rd
- 301 Greenfield Rd
- 181 Francestown Rd
- 514 Old Greenfield Rd
- 16 Bobalink Cir
- 18 E Ridge Dr
- 51 Lucy Ln
- 39 Lucy Ln