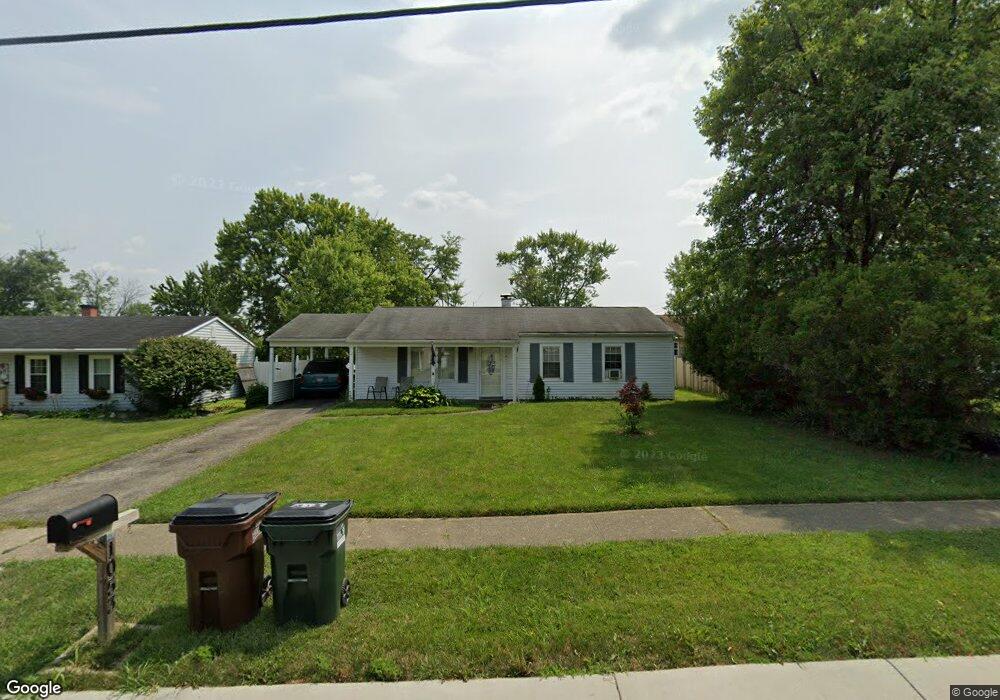
1053 Garnoa Dr Cincinnati, OH 45231
Winton Lake NeighborhoodEstimated Value: $121,000 - $188,000
3
Beds
1
Bath
1,025
Sq Ft
$162/Sq Ft
Est. Value
About This Home
This home is located at 1053 Garnoa Dr, Cincinnati, OH 45231 and is currently estimated at $166,088, approximately $162 per square foot. 1053 Garnoa Dr is a home located in Hamilton County with nearby schools including John Paul II Catholic School.
Ownership History
Date
Name
Owned For
Owner Type
Purchase Details
Closed on
Dec 9, 2010
Sold by
Fannie Mae
Bought by
Tye Kevin L and Tye Angela M
Current Estimated Value
Home Financials for this Owner
Home Financials are based on the most recent Mortgage that was taken out on this home.
Original Mortgage
$26,000
Interest Rate
4.85%
Mortgage Type
New Conventional
Purchase Details
Closed on
Feb 16, 2007
Sold by
Collins Mark J and Collins Stephanie M
Bought by
Cross John H
Home Financials for this Owner
Home Financials are based on the most recent Mortgage that was taken out on this home.
Original Mortgage
$94,900
Interest Rate
6.28%
Mortgage Type
Unknown
Purchase Details
Closed on
Nov 10, 2000
Sold by
Guckenbergr Shelburne Debra Kyle and Angela Stron
Bought by
Collins Mark J
Home Financials for this Owner
Home Financials are based on the most recent Mortgage that was taken out on this home.
Original Mortgage
$78,425
Interest Rate
7.86%
Mortgage Type
FHA
Purchase Details
Closed on
May 30, 1995
Sold by
Chapman Scott E
Bought by
Shelburne Debra Kyle and Guckenberger Angela Strong
Home Financials for this Owner
Home Financials are based on the most recent Mortgage that was taken out on this home.
Original Mortgage
$60,800
Interest Rate
8.26%
Create a Home Valuation Report for This Property
The Home Valuation Report is an in-depth analysis detailing your home's value as well as a comparison with similar homes in the area
Home Values in the Area
Average Home Value in this Area
Purchase History
| Date | Buyer | Sale Price | Title Company |
|---|---|---|---|
| Tye Kevin L | -- | None Available | |
| Cross John H | $94,900 | Attorney | |
| Collins Mark J | $78,500 | -- | |
| Shelburne Debra Kyle | -- | -- |
Source: Public Records
Mortgage History
| Date | Status | Borrower | Loan Amount |
|---|---|---|---|
| Previous Owner | Tye Kevin L | $26,000 | |
| Previous Owner | Cross John H | $94,900 | |
| Previous Owner | Collins Mark J | $78,425 | |
| Previous Owner | Shelburne Debra Kyle | $60,800 |
Source: Public Records
Tax History Compared to Growth
Tax History
| Year | Tax Paid | Tax Assessment Tax Assessment Total Assessment is a certain percentage of the fair market value that is determined by local assessors to be the total taxable value of land and additions on the property. | Land | Improvement |
|---|---|---|---|---|
| 2024 | $2,808 | $40,492 | $10,371 | $30,121 |
| 2023 | $2,652 | $40,492 | $10,371 | $30,121 |
| 2022 | $2,371 | $27,171 | $8,243 | $18,928 |
| 2021 | $2,364 | $27,171 | $8,243 | $18,928 |
| 2020 | $2,338 | $27,171 | $8,243 | $18,928 |
| 2019 | $2,164 | $23,027 | $6,986 | $16,041 |
| 2018 | $2,167 | $23,027 | $6,986 | $16,041 |
| 2017 | $2,115 | $23,027 | $6,986 | $16,041 |
| 2016 | $1,389 | $14,616 | $6,902 | $7,714 |
| 2015 | $1,283 | $14,616 | $6,902 | $7,714 |
| 2014 | $1,276 | $14,616 | $6,902 | $7,714 |
| 2013 | $1,352 | $16,801 | $7,935 | $8,866 |
Source: Public Records
Map
Nearby Homes
- 9413 Stoneybrooke
- 8491 Daly Rd
- 9315 Winton Rd
- 9319 Winton Rd
- 1050 Meredith Dr
- 10040 Daly Rd
- 820 Compton Rd
- 831 Compton Rd
- 9132 Millcliff Dr
- 729 Fleming Rd
- 1100 Gracewind Ct
- 9320 Rambler Place
- 1190 Sugartree Ct
- 8925 Monsanto Dr
- 8950 Daly Rd
- 9458 Long Ln
- 613 Heatherdale Dr
- 9731 Culpepper Ct
- 8831 Daly Rd
- 958 Hollytree Dr
- 1047 Garnoa Dr
- 9698 Fernbrook Ct
- 9690 Fernbrook Ct
- 1041 Garnoa Dr
- 9678 Fernbrook Ct
- 1033 Garnoa Dr
- 9677 Crestbrook Dr
- 9687 Crestbrook Dr
- 9695 Fernbrook Ct
- 1069 Garnoa Dr
- 1056 Garnoa Dr
- 1050 Garnoa Dr
- 1034 Garnoa Dr
- 9669 Crestbrook Dr
- 1062 Garnoa Dr
- 1064 Garnoa Dr
- 9659 Crestbrook Dr
- 9670 Fernbrook Ct
- 1068 Garnoa Dr
- 9649 Crestbrook Dr