1053 Hibbler St West Point, MS 39773
Estimated Value: $142,001 - $190,000
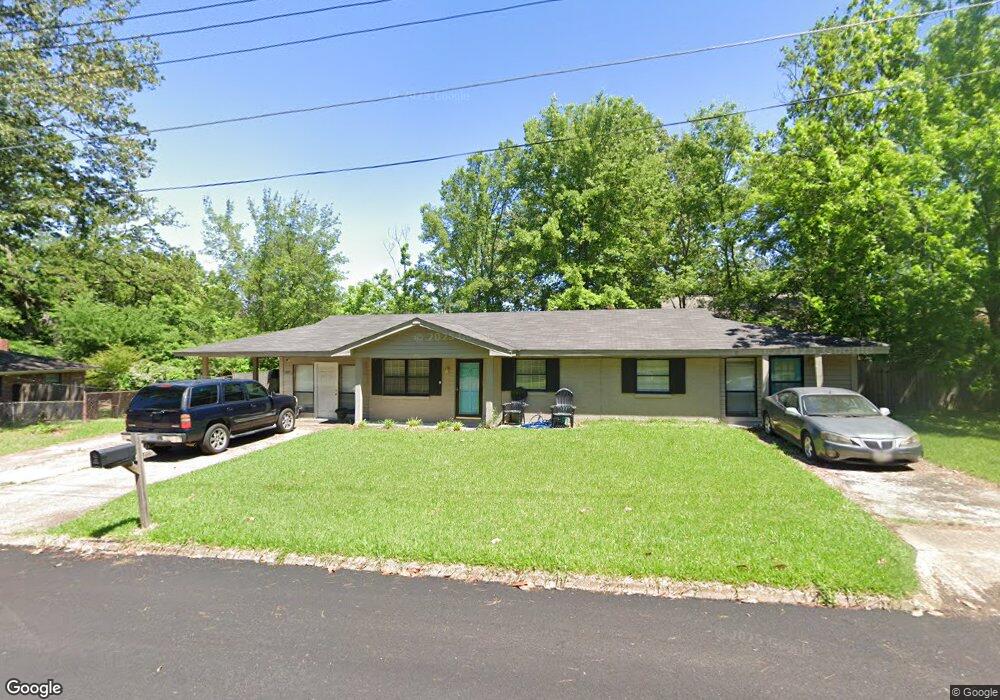
About This Home
This home is located at 1053 Hibbler St, West Point, MS 39773 and is currently estimated at $174,750, approximately $89 per square foot. 1053 Hibbler St is a home located in Clay County with nearby schools including East Side Elementary School, West Clay Elementary School, and South Side Elementary School.
Ownership History
We collect this data history from publicly available records. To have your information removed, we recommend requesting removal directly through your county’s website.
Purchase Details
Purchase History
We collect this data history from publicly available records. To have your information removed, we recommend requesting removal directly through your county’s website.
| Date | Buyer | Sale Price | Title Company |
|---|---|---|---|
| -- | -- |
Tax History
We collect this data history from publicly available records. To have your information removed, we recommend requesting removal directly through your county’s website.
| Year | Tax Paid | Tax Assessment Tax Assessment Total Assessment is a certain percentage of the fair market value that is determined by local assessors to be the total taxable value of land and additions on the property. | Land | Improvement |
|---|---|---|---|---|
| 2025 | $473 | $11,128 | $1,484 | $9,644 |
| 2024 | $453 | $11,128 | $1,484 | $9,644 |
| 2023 | $1,107 | $9,402 | $1,484 | $7,918 |
| 2022 | $366 | $9,402 | $1,484 | $7,918 |
| 2021 | $364 | $9,402 | $1,484 | $7,918 |
| 2020 | $367 | $9,402 | $1,484 | $7,918 |
| 2019 | $329 | $9,330 | $1,484 | $7,846 |
| 2018 | $310 | $9,330 | $1,484 | $7,846 |
| 2017 | $310 | $9,330 | $1,484 | $7,846 |
| 2016 | $301 | $9,330 | $1,484 | $7,846 |
| 2015 | $268 | $8,377 | $1,484 | $6,893 |
| 2014 | $209 | $8,377 | $1,484 | $6,893 |
| 2013 | $209 | $8,377 | $1,484 | $6,893 |
Map
- 1414 E Brame Ave
- 405 S Eshman Ave
- 228 Mccord St
- 44 Torbert Dr
- 317 Clark Cir
- 35 Rich St
- 341 Mccord St
- 355 Mccord St
- 229 Clark Cir
- 170 Meadow Hill Rd
- 329 Converse Dr
- 112 Meadow Hill Rd
- 98 Calhoun St
- 238 Calhoun St
- 556 Mccord St
- 963 E Broad St
- 440 Calhoun St
- 27185 E Main St
- 27045 E Main St
- 389 Mapleview Rd
Ask me questions while you tour the home.