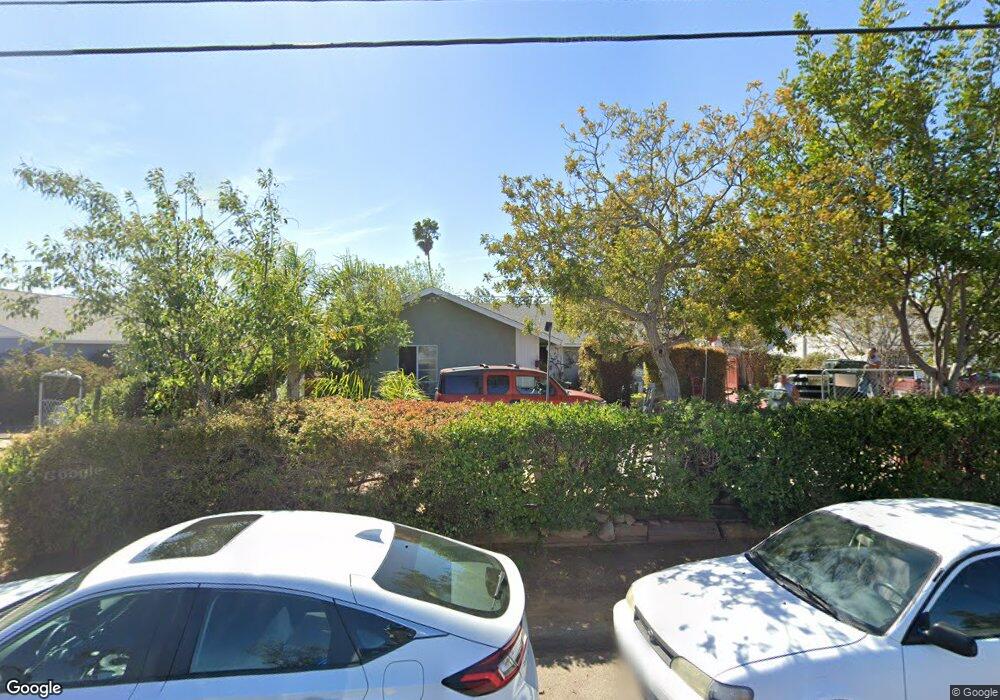
1053 N Fig St Escondido, CA 92026
Central Escondido NeighborhoodEstimated Value: $656,000 - $726,000
3
Beds
1
Bath
1,161
Sq Ft
$596/Sq Ft
Est. Value
About This Home
This home is located at 1053 N Fig St, Escondido, CA 92026 and is currently estimated at $691,594, approximately $595 per square foot. 1053 N Fig St is a home located in San Diego County with nearby schools including Farr Avenue Elementary, Mission Middle, and Escondido High School.
Ownership History
Date
Name
Owned For
Owner Type
Purchase Details
Closed on
Aug 17, 2015
Sold by
Dereyes Higinia Valentin and Reyes Aaron
Bought by
Valentin Francisco David Reyes
Current Estimated Value
Purchase Details
Closed on
Apr 4, 2013
Sold by
Valentin Francisco David Reyes
Bought by
Valentin Francisco David Reyes and Dereyes Higinia Valentin
Purchase Details
Closed on
Jun 26, 2001
Sold by
Reyes Edith Rosario
Bought by
Valentin Francisco David Reyes
Home Financials for this Owner
Home Financials are based on the most recent Mortgage that was taken out on this home.
Original Mortgage
$197,925
Interest Rate
7.21%
Mortgage Type
FHA
Purchase Details
Closed on
Jun 8, 2001
Sold by
Smith Clyde R and Smith Carol D
Bought by
Valentin Francisco David Reyes
Home Financials for this Owner
Home Financials are based on the most recent Mortgage that was taken out on this home.
Original Mortgage
$197,925
Interest Rate
7.21%
Mortgage Type
FHA
Create a Home Valuation Report for This Property
The Home Valuation Report is an in-depth analysis detailing your home's value as well as a comparison with similar homes in the area
Home Values in the Area
Average Home Value in this Area
Purchase History
| Date | Buyer | Sale Price | Title Company |
|---|---|---|---|
| Valentin Francisco David Reyes | -- | None Available | |
| Valentin Francisco David Reyes | -- | None Available | |
| Valentin Francisco David Reyes | -- | New Century Title Company | |
| Valentin Francisco David Reyes | $214,000 | New Century Title Company |
Source: Public Records
Mortgage History
| Date | Status | Borrower | Loan Amount |
|---|---|---|---|
| Previous Owner | Valentin Francisco David Reyes | $197,925 |
Source: Public Records
Tax History
| Year | Tax Paid | Tax Assessment Tax Assessment Total Assessment is a certain percentage of the fair market value that is determined by local assessors to be the total taxable value of land and additions on the property. | Land | Improvement |
|---|---|---|---|---|
| 2025 | $3,566 | $316,116 | $132,943 | $183,173 |
| 2024 | $3,566 | $309,919 | $130,337 | $179,582 |
| 2023 | $3,485 | $303,843 | $127,782 | $176,061 |
| 2022 | $3,448 | $297,886 | $125,277 | $172,609 |
| 2021 | $3,392 | $292,046 | $122,821 | $169,225 |
| 2020 | $3,372 | $289,052 | $121,562 | $167,490 |
| 2019 | $3,291 | $283,385 | $119,179 | $164,206 |
| 2018 | $3,201 | $277,830 | $116,843 | $160,987 |
| 2017 | $3,149 | $272,383 | $114,552 | $157,831 |
| 2016 | $3,088 | $267,043 | $112,306 | $154,737 |
| 2015 | $3,063 | $263,033 | $110,620 | $152,413 |
| 2014 | $2,937 | $257,882 | $108,454 | $149,428 |
Source: Public Records
Map
Nearby Homes
- 910 N Fig St Unit D
- 1250 N Ivy St
- 739 Park Place
- 664 N Fig St
- 1240 N Broadway Unit 5
- 1240 N Broadway Unit 31
- 1313 Taft St
- 112 Espanas Glen
- 810 E Washington Ave Unit E
- 818 E Washington Ave Unit B
- 804 E Washington Ave Unit C
- 1020 E Washington Ave Unit 88
- 1020 E Washington Ave Unit 107
- 1010 E Washington Ave Unit 72
- 1010 E Washington Ave Unit 73
- 140 E El Norte Pkwy Unit 6
- 1060 E Washington Ave Unit 5
- 1040 E Washington Ave Unit 33
- 1040 E Washington Ave
- 1225 N Broadway Unit 20
Your Personal Tour Guide
Ask me questions while you tour the home.