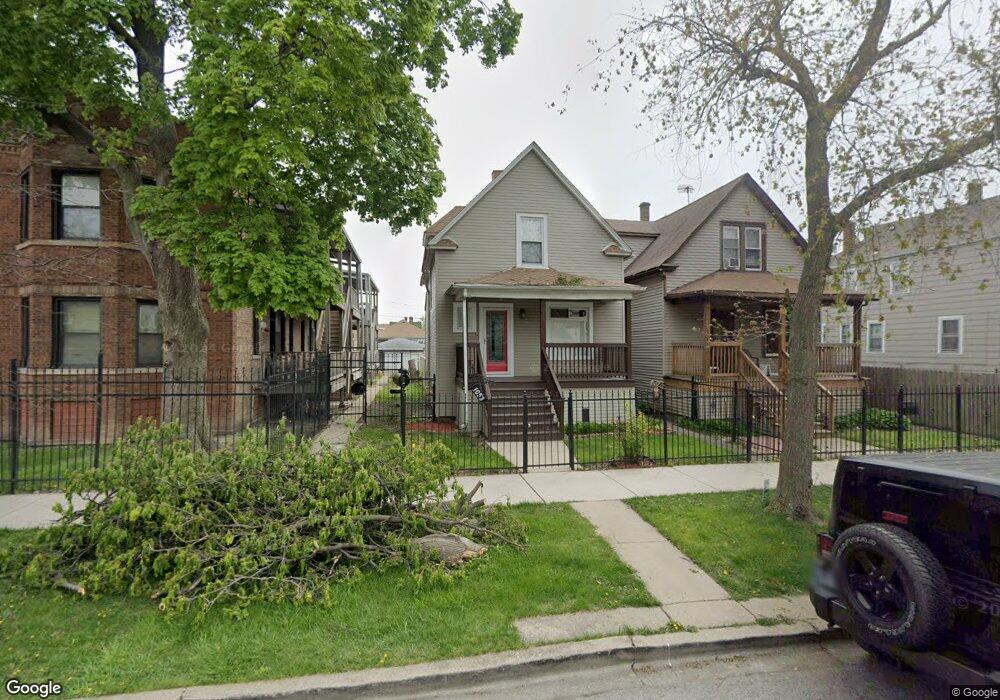
1053 N Mason Ave Chicago, IL 60651
Austin NeighborhoodEstimated Value: $221,000 - $293,000
3
Beds
2
Baths
1,060
Sq Ft
$244/Sq Ft
Est. Value
About This Home
This home is located at 1053 N Mason Ave, Chicago, IL 60651 and is currently estimated at $258,888, approximately $244 per square foot. 1053 N Mason Ave is a home located in Cook County with nearby schools including St Angela Elementary School, The Field School, and St Paul Lutheran School.
Ownership History
Date
Name
Owned For
Owner Type
Purchase Details
Closed on
Nov 18, 2009
Sold by
Liquidation Properties Inc
Bought by
Cherry Waymon
Current Estimated Value
Purchase Details
Closed on
Oct 30, 2009
Sold by
Peterson Ronette R
Bought by
Liquidation Properties Inc
Purchase Details
Closed on
Jun 25, 2004
Sold by
Hud
Bought by
Peterson Ronette Renee
Home Financials for this Owner
Home Financials are based on the most recent Mortgage that was taken out on this home.
Original Mortgage
$120,000
Interest Rate
9.8%
Mortgage Type
Unknown
Purchase Details
Closed on
Dec 16, 2003
Sold by
Williams Anneke D
Bought by
Hud
Purchase Details
Closed on
Apr 29, 1997
Sold by
Gilson Pearl and Corbin Pearl
Bought by
Williams Anneke D
Home Financials for this Owner
Home Financials are based on the most recent Mortgage that was taken out on this home.
Original Mortgage
$71,063
Interest Rate
8.05%
Mortgage Type
FHA
Create a Home Valuation Report for This Property
The Home Valuation Report is an in-depth analysis detailing your home's value as well as a comparison with similar homes in the area
Home Values in the Area
Average Home Value in this Area
Purchase History
| Date | Buyer | Sale Price | Title Company |
|---|---|---|---|
| Cherry Waymon | $22,000 | First American Title | |
| Liquidation Properties Inc | -- | None Available | |
| Peterson Ronette Renee | -- | Stewart Title Of Illinois | |
| Hud | -- | -- | |
| Williams Anneke D | $71,000 | -- |
Source: Public Records
Mortgage History
| Date | Status | Borrower | Loan Amount |
|---|---|---|---|
| Previous Owner | Peterson Ronette Renee | $120,000 | |
| Previous Owner | Williams Anneke D | $71,063 |
Source: Public Records
Tax History Compared to Growth
Tax History
| Year | Tax Paid | Tax Assessment Tax Assessment Total Assessment is a certain percentage of the fair market value that is determined by local assessors to be the total taxable value of land and additions on the property. | Land | Improvement |
|---|---|---|---|---|
| 2024 | $2,465 | $15,900 | $3,720 | $12,180 |
| 2023 | $2,382 | $15,000 | $2,945 | $12,055 |
| 2022 | $2,382 | $15,000 | $2,945 | $12,055 |
| 2021 | $2,347 | $15,000 | $2,945 | $12,055 |
| 2020 | $2,018 | $12,163 | $2,635 | $9,528 |
| 2019 | $2,026 | $13,515 | $2,635 | $10,880 |
| 2018 | $1,991 | $13,515 | $2,635 | $10,880 |
| 2017 | $2,040 | $12,850 | $2,325 | $10,525 |
| 2016 | $2,074 | $12,850 | $2,325 | $10,525 |
| 2015 | $1,874 | $12,850 | $2,325 | $10,525 |
| 2014 | $1,689 | $11,670 | $2,170 | $9,500 |
| 2013 | $1,644 | $11,670 | $2,170 | $9,500 |
Source: Public Records
Map
Nearby Homes
- 1122 N Mason Ave
- 1032 N Austin Blvd Unit 2N
- 1144 N Austin Blvd
- 1118 N Monitor Ave
- 7211 W Division St Unit C2
- 802 N Taylor Ave
- 19 Augusta St
- 910 N Humphrey Ave
- 914 N Austin Blvd Unit A5
- 5962 W Iowa St
- 921 N Humphrey Ave
- 1108 N Massasoit Ave
- 5828 W Iowa St
- 546 N Humphrey Ave
- 1133 N Massasoit Ave
- 824 N Austin Blvd Unit 3E
- 5830 W Rice St
- 1322 N Austin Blvd
- 1001 N Taylor Ave
- 1318 N Menard Ave
- 1051 N Mason Ave
- 5915 W Thomas St
- 1047 N Mason Ave
- 1045 N Mason Ave Unit 1
- 1039 N Mason Ave Unit 2
- 1050 N Mayfield Ave
- 1054 N Mayfield Ave
- 1046 N Mayfield Ave
- 1056 N Mayfield Ave
- 1101 N Mason Ave
- 1044 N Mayfield Ave
- 1040 N Mayfield Ave
- 1056 N Mason Ave
- 1054 N Mason Ave
- 1054 N Mason Ave Unit 1A
- 1050 N Mason Ave
- 1046 N Mason Ave Unit 1
- 1038 N Mayfield Ave
- 1033 N Mason Ave
- 1107 N Mason Ave