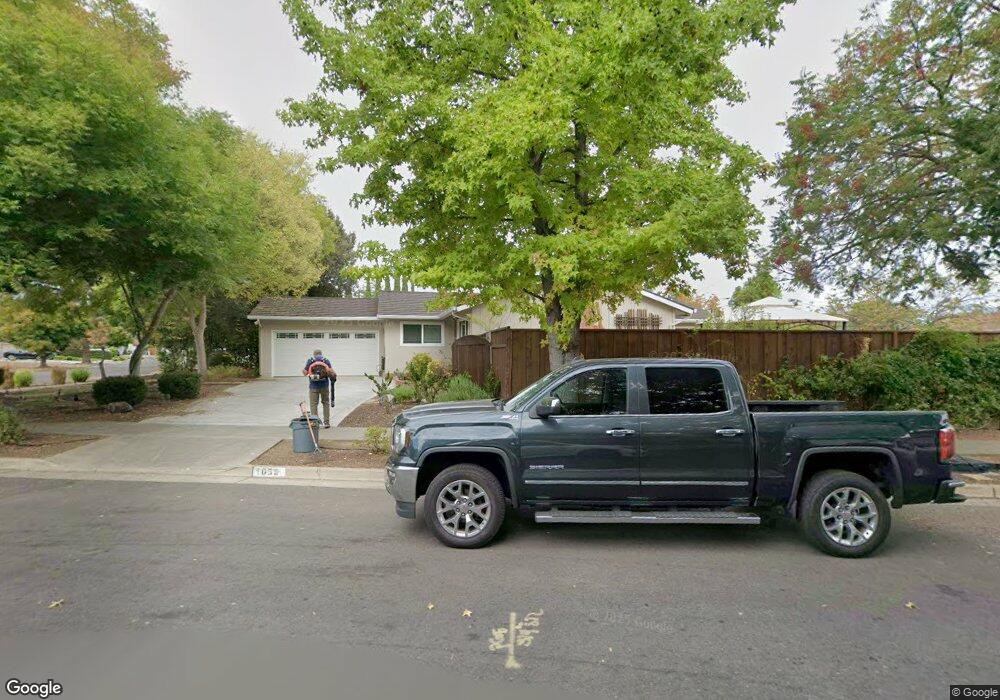
1053 W Riverside Way San Jose, CA 95129
West San Jose NeighborhoodEstimated Value: $2,665,000 - $3,459,000
3
Beds
2
Baths
1,141
Sq Ft
$2,694/Sq Ft
Est. Value
About This Home
This home is located at 1053 W Riverside Way, San Jose, CA 95129 and is currently estimated at $3,074,131, approximately $2,694 per square foot. 1053 W Riverside Way is a home located in Santa Clara County with nearby schools including Nelson S. Dilworth Elementary School, Joaquin Miller Middle, and Lynbrook High School.
Ownership History
Date
Name
Owned For
Owner Type
Purchase Details
Closed on
Aug 17, 2012
Sold by
Stevens Sheri
Bought by
Stevens Sheri
Current Estimated Value
Home Financials for this Owner
Home Financials are based on the most recent Mortgage that was taken out on this home.
Original Mortgage
$325,000
Interest Rate
3.49%
Mortgage Type
New Conventional
Purchase Details
Closed on
Jul 16, 2009
Sold by
Stevens Sheri
Bought by
Stevens Sheri
Purchase Details
Closed on
Mar 6, 2009
Sold by
Stevens Sheri and Gerardin Sheri Stevens
Bought by
Stevens Sheri
Home Financials for this Owner
Home Financials are based on the most recent Mortgage that was taken out on this home.
Original Mortgage
$343,500
Interest Rate
5.03%
Mortgage Type
New Conventional
Purchase Details
Closed on
Jul 27, 2001
Sold by
Gerardin Gerard and Gerardin Sheri S
Bought by
Gerardin Sheri Stevens
Home Financials for this Owner
Home Financials are based on the most recent Mortgage that was taken out on this home.
Original Mortgage
$365,000
Interest Rate
7.1%
Create a Home Valuation Report for This Property
The Home Valuation Report is an in-depth analysis detailing your home's value as well as a comparison with similar homes in the area
Home Values in the Area
Average Home Value in this Area
Purchase History
| Date | Buyer | Sale Price | Title Company |
|---|---|---|---|
| Stevens Sheri | -- | Fidelity National Title Co | |
| Stevens Sheri | -- | None Available | |
| Stevens Sheri | -- | Fidelity National Title Co | |
| Gerardin Sheri Stevens | $140,000 | Alliance Title Company |
Source: Public Records
Mortgage History
| Date | Status | Borrower | Loan Amount |
|---|---|---|---|
| Closed | Stevens Sheri | $325,000 | |
| Closed | Stevens Sheri | $343,500 | |
| Closed | Gerardin Sheri Stevens | $365,000 |
Source: Public Records
Tax History Compared to Growth
Tax History
| Year | Tax Paid | Tax Assessment Tax Assessment Total Assessment is a certain percentage of the fair market value that is determined by local assessors to be the total taxable value of land and additions on the property. | Land | Improvement |
|---|---|---|---|---|
| 2025 | $5,546 | $343,713 | $135,750 | $207,963 |
| 2024 | $5,546 | $336,975 | $133,089 | $203,886 |
| 2023 | $5,443 | $330,369 | $130,480 | $199,889 |
| 2022 | $5,597 | $323,892 | $127,922 | $195,970 |
| 2021 | $5,470 | $317,542 | $125,414 | $192,128 |
| 2020 | $5,333 | $314,287 | $124,129 | $190,158 |
| 2019 | $5,206 | $308,126 | $121,696 | $186,430 |
| 2018 | $5,065 | $302,085 | $119,310 | $182,775 |
| 2017 | $5,028 | $296,163 | $116,971 | $179,192 |
| 2016 | $4,869 | $290,357 | $114,678 | $175,679 |
| 2015 | $4,988 | $285,997 | $112,956 | $173,041 |
| 2014 | $4,344 | $280,396 | $110,744 | $169,652 |
Source: Public Records
Map
Nearby Homes
- 10842 E Estates Dr
- 10777 W Estates Dr
- 6757 Devonshire Dr
- 6365 Candlewood Ct
- 20564 Kirwin Ln
- 6179 Shadygrove Dr
- 6915 Dartmoor Way
- 00 Cleo Ave
- 10357 Greenwood Ct
- 6886 Chantel Ct
- 6923 Chantel Ct Unit 92
- 1167 Fairford Way
- 10209 Danube Dr
- 1092 Strayer Dr
- 19220 Tilson Ave
- 10101 Richwood Dr
- 20882 Cherryland Dr
- 20858 Cherryland Dr
- 20876 Cherryland Dr
- 19999 Stevens Creek Blvd Unit 209
- 6759 Mason Way
- 1043 W Riverside Way
- 1033 W Riverside Way
- 6767 Mason Way
- 1054 W Riverside Way
- 1052 W Riverside Way
- 1031 W Riverside Way
- 1059 W Riverside Way
- 1050 W Riverside Way
- 1029 W Riverside Way
- 1060 W Riverside Way
- 6775 Mason Way
- 6764 Mason Way
- 1048 W Riverside Way
- 6772 Mason Way
- 1044 W Riverside Way
- 1027 W Riverside Way
- 1064 W Riverside Way
- 6785 Mason Way
- 1042 W Riverside Way