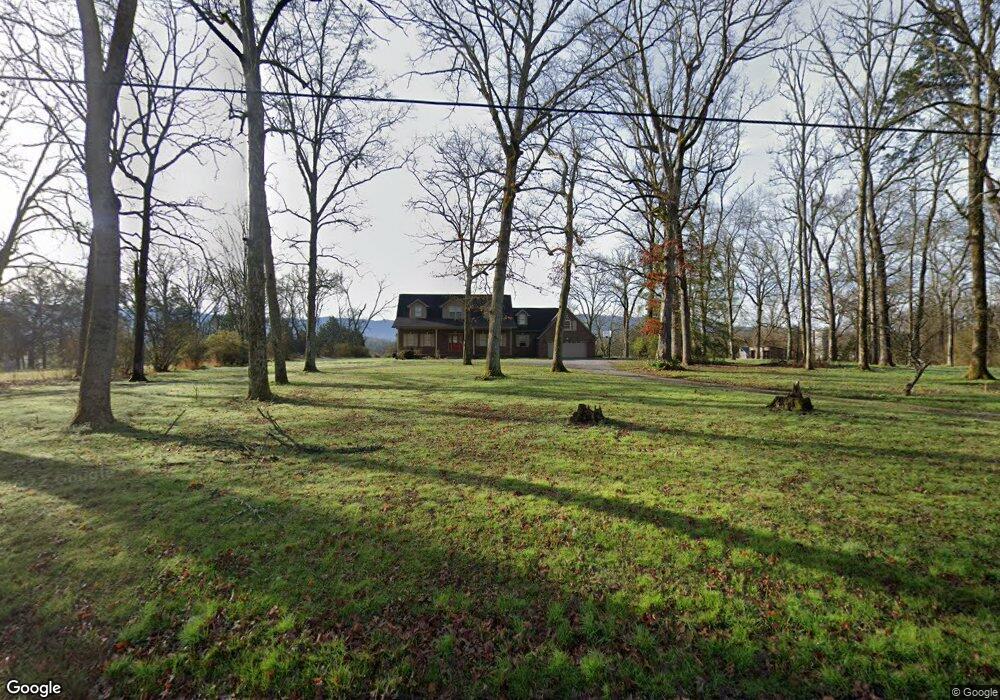
1053 Wye Dr Seymour, TN 37865
Estimated Value: $556,000 - $560,437
3
Beds
3
Baths
4,058
Sq Ft
$138/Sq Ft
Est. Value
About This Home
This home is located at 1053 Wye Dr, Seymour, TN 37865 and is currently estimated at $558,219, approximately $137 per square foot. 1053 Wye Dr is a home located in Sevier County with nearby schools including Northview Elementary School, Catons Chapel Elementary School, and Jones Cove Elementary School.
Ownership History
Date
Name
Owned For
Owner Type
Purchase Details
Closed on
Feb 23, 2010
Sold by
Federal National Mortgage Association
Bought by
Ingle Robert V
Current Estimated Value
Purchase Details
Closed on
Nov 24, 2009
Sold by
Hudgins Nathan C
Bought by
Federal National Mtg Associati
Purchase Details
Closed on
Oct 7, 2008
Sold by
Lehman Brothers Bank
Bought by
Hudgins Nathan
Home Financials for this Owner
Home Financials are based on the most recent Mortgage that was taken out on this home.
Original Mortgage
$242,250
Interest Rate
6.11%
Purchase Details
Closed on
Jun 11, 2008
Sold by
Dwayne Johnson
Bought by
Property Asset Management Inc
Purchase Details
Closed on
Sep 29, 2005
Sold by
Dwayne Johnson
Bought by
Dwayne Johnson
Purchase Details
Closed on
Feb 4, 2005
Sold by
Sullivan Shirley K
Bought by
Dwayne Johnson
Purchase Details
Closed on
Feb 4, 2000
Sold by
Frederick Sullivan
Bought by
Sullivan Shirley K
Create a Home Valuation Report for This Property
The Home Valuation Report is an in-depth analysis detailing your home's value as well as a comparison with similar homes in the area
Home Values in the Area
Average Home Value in this Area
Purchase History
| Date | Buyer | Sale Price | Title Company |
|---|---|---|---|
| Ingle Robert V | $186,000 | -- | |
| Federal National Mtg Associati | -- | -- | |
| Hudgins Nathan | $255,000 | -- | |
| Lehman Brothers Bank | -- | -- | |
| Property Asset Management Inc | $198,750 | -- | |
| Dwayne Johnson | -- | -- | |
| Dwayne Johnson | $346,000 | -- | |
| Sullivan Shirley K | -- | -- |
Source: Public Records
Mortgage History
| Date | Status | Borrower | Loan Amount |
|---|---|---|---|
| Previous Owner | Sullivan Shirley K | $242,250 |
Source: Public Records
Tax History Compared to Growth
Tax History
| Year | Tax Paid | Tax Assessment Tax Assessment Total Assessment is a certain percentage of the fair market value that is determined by local assessors to be the total taxable value of land and additions on the property. | Land | Improvement |
|---|---|---|---|---|
| 2025 | $1,130 | $76,350 | $13,700 | $62,650 |
| 2024 | $1,130 | $76,350 | $13,700 | $62,650 |
| 2023 | $1,130 | $76,350 | $0 | $0 |
| 2022 | $1,130 | $76,350 | $13,700 | $62,650 |
| 2021 | $1,130 | $76,350 | $13,700 | $62,650 |
| 2020 | $1,148 | $76,350 | $13,700 | $62,650 |
| 2019 | $1,148 | $61,725 | $14,075 | $47,650 |
| 2018 | $1,148 | $61,725 | $14,075 | $47,650 |
| 2017 | $1,148 | $61,725 | $14,075 | $47,650 |
| 2016 | $1,148 | $61,725 | $14,075 | $47,650 |
| 2015 | -- | $61,700 | $0 | $0 |
| 2014 | $1,005 | $61,682 | $0 | $0 |
Source: Public Records
Map
Nearby Homes
- 706 Paso Trail Way
- 1008 Keener Rd Unit 1010
- 1036 Stanton Rd
- 813 Wye Dr
- 761 N Knob Creek Rd
- 0 Wye Dr
- 1108 Stanton Rd
- 703 N Knob Creek Rd
- 1565 Ellejoy Rd
- 1531 Ellejoy Rd
- 1506 Cunningham Rd W
- 924 Crest Ct
- 1040 Pathways Dr
- 237 Westmoreland Ct
- 408 Winners Cir
- 205 Blue Ridge Ln
- 1419 S Delozier Rd
- 5925 Sevierville Rd
- Tract 2 Wye Dr
- Lot 29 Bluff Shadows Ln