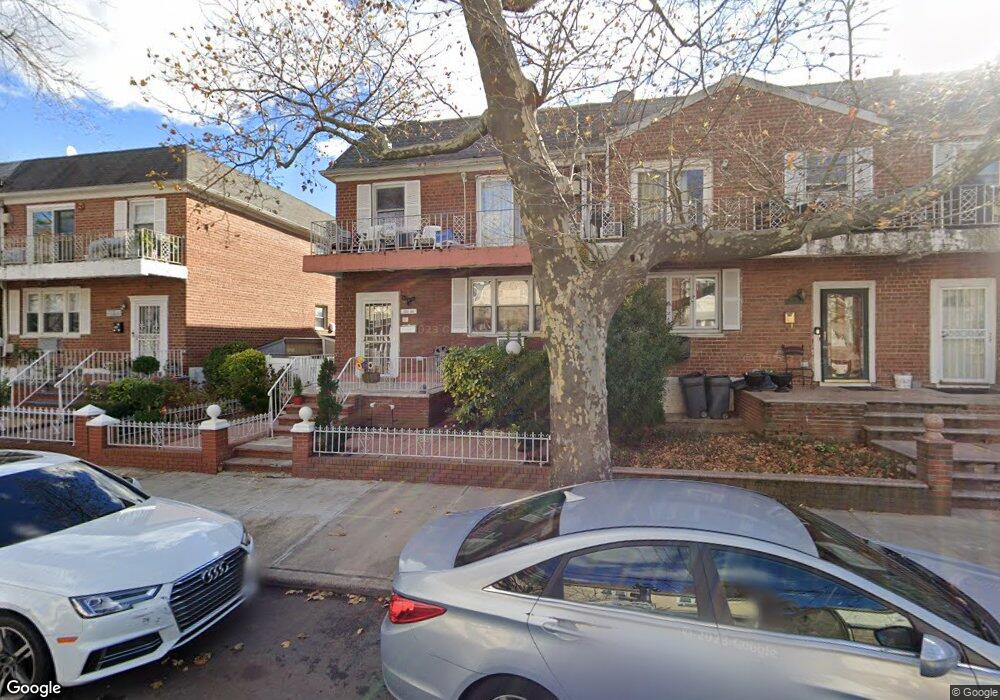
10530 Flatlands 3rd St Unit 2 Brooklyn, NY 11236
Canarsie NeighborhoodEstimated Value: $838,645 - $1,059,000
3
Beds
1
Bath
2,200
Sq Ft
$422/Sq Ft
Est. Value
About This Home
This home is located at 10530 Flatlands 3rd St Unit 2, Brooklyn, NY 11236 and is currently estimated at $929,161, approximately $422 per square foot. 10530 Flatlands 3rd St Unit 2 is a home located in Kings County with nearby schools including P.S. 279 Herman Schreiber, I.S. 211 John Wilson, and Canarsie Ascend Charter School.
Ownership History
Date
Name
Owned For
Owner Type
Purchase Details
Closed on
Nov 16, 2021
Sold by
Lee Aston W
Bought by
Llewellyn Althea
Current Estimated Value
Home Financials for this Owner
Home Financials are based on the most recent Mortgage that was taken out on this home.
Original Mortgage
$811,750
Outstanding Balance
$744,857
Interest Rate
3.09%
Mortgage Type
Purchase Money Mortgage
Estimated Equity
$184,304
Purchase Details
Closed on
Mar 12, 2001
Sold by
Lindsay Robert
Bought by
Lee Aston W
Home Financials for this Owner
Home Financials are based on the most recent Mortgage that was taken out on this home.
Original Mortgage
$283,500
Interest Rate
6.9%
Purchase Details
Closed on
Jun 19, 1989
Sold by
Zelenetz Marvin
Bought by
Lindsay Robert and Lindsay Cynthia
Create a Home Valuation Report for This Property
The Home Valuation Report is an in-depth analysis detailing your home's value as well as a comparison with similar homes in the area
Home Values in the Area
Average Home Value in this Area
Purchase History
| Date | Buyer | Sale Price | Title Company |
|---|---|---|---|
| Llewellyn Althea | $955,000 | -- | |
| Lee Aston W | -- | -- | |
| Lindsay Robert | -- | -- |
Source: Public Records
Mortgage History
| Date | Status | Borrower | Loan Amount |
|---|---|---|---|
| Open | Llewellyn Althea | $811,750 | |
| Previous Owner | Lee Aston W | $283,500 |
Source: Public Records
Tax History
| Year | Tax Paid | Tax Assessment Tax Assessment Total Assessment is a certain percentage of the fair market value that is determined by local assessors to be the total taxable value of land and additions on the property. | Land | Improvement |
|---|---|---|---|---|
| 2025 | $7,693 | $47,880 | $13,800 | $34,080 |
| 2024 | $7,693 | $52,800 | $13,800 | $39,000 |
| 2023 | $7,339 | $46,140 | $13,800 | $32,340 |
| 2022 | $6,805 | $41,700 | $13,800 | $27,900 |
| 2021 | $6,768 | $32,160 | $13,800 | $18,360 |
| 2019 | $6,793 | $36,060 | $13,800 | $22,260 |
| 2018 | $6,569 | $32,227 | $12,958 | $19,269 |
| 2017 | $6,198 | $30,403 | $10,134 | $20,269 |
| 2016 | $5,734 | $28,683 | $10,833 | $17,850 |
| 2015 | $3,876 | $27,060 | $11,520 | $15,540 |
| 2014 | $3,876 | $27,060 | $11,520 | $15,540 |
Source: Public Records
Map
Nearby Homes
- 10530 Avenue K
- 1125 E 104th St
- 1060 E 105th St
- 1054 E 105th St
- 1235 E 104th St
- 1041 E 104th St
- 10224 Avenue K
- 1115 E 102nd St
- 10716 Avenue J
- 1011 E 108th St Unit 1D
- 1161 E 101st St
- 982 E 106th St
- 1131 E 101st St
- 10561 Flatlands 7th St
- 10567 Flatlands 7th St
- 10811 Flatlands 7th St
- 1052 E 102nd St
- 989 E 108th St Unit BB
- 10542 Flatlands 7th St
- 1154 E 101st St
- 10530 Flatlands 3rd St
- 10526 Flatlands 3rd St
- 10534 Flatlands 3rd St
- 10524 Flatlands 3rd St
- 10538 Flatlands 3rd St
- 10520 Flatlands 3rd St
- 10540 Flatlands 3rd St
- 10518 Flatlands 3rd St
- 10542 Flatlands 3rd St
- 10531 Flatlands 4th St
- 10525 Flatlands 4th St
- 10533 Flatlands 4th St
- 10523 Flatlands 4th St
- 10523 Flatlands 4th St Unit Building
- 10514 Flatlands 3rd St
- 10544 Flatlands 3rd St
- 10519 Flatlands 4th St
- 10519 Flatlands 4 St
- 10539 Flatlands 4th St
- 10517 Flatlands 4th St
Your Personal Tour Guide
Ask me questions while you tour the home.