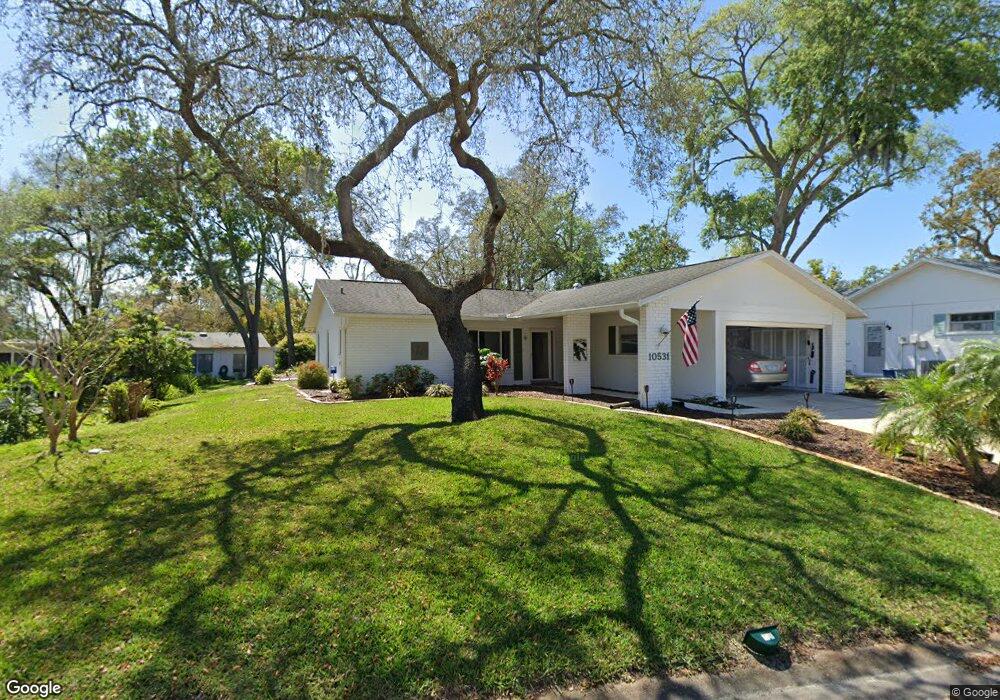
10531 Calico Loop Port Richey, FL 34668
Estimated Value: $230,578 - $259,000
2
Beds
2
Baths
2,294
Sq Ft
$108/Sq Ft
Est. Value
About This Home
This home is located at 10531 Calico Loop, Port Richey, FL 34668 and is currently estimated at $247,645, approximately $107 per square foot. 10531 Calico Loop is a home located in Pasco County with nearby schools including Schrader Elementary School, Bayonet Point Middle School, and Fivay High School.
Ownership History
Date
Name
Owned For
Owner Type
Purchase Details
Closed on
Feb 25, 2014
Sold by
Aul Stephen E
Bought by
Aul Stephen E and Cooper Michele L
Current Estimated Value
Purchase Details
Closed on
Apr 1, 2013
Sold by
Gordon Estelle
Bought by
Aul Stephen E
Purchase Details
Closed on
Jul 10, 2005
Sold by
Gordon Robert and Gordon Estelle
Bought by
Gordon Estelle
Home Financials for this Owner
Home Financials are based on the most recent Mortgage that was taken out on this home.
Original Mortgage
$74,150
Interest Rate
5.71%
Mortgage Type
Fannie Mae Freddie Mac
Purchase Details
Closed on
Jun 3, 2002
Sold by
Wiitanen George L and Wiitanen Aileen M
Bought by
Gordon Robert and Gordon Estelle
Home Financials for this Owner
Home Financials are based on the most recent Mortgage that was taken out on this home.
Original Mortgage
$57,000
Interest Rate
6.92%
Mortgage Type
New Conventional
Purchase Details
Closed on
Oct 21, 1996
Sold by
George L Wiitanen Tr and Aileen M Wiitanen Tr
Bought by
Wiitanen George L and Wiitanen Aileen M
Create a Home Valuation Report for This Property
The Home Valuation Report is an in-depth analysis detailing your home's value as well as a comparison with similar homes in the area
Home Values in the Area
Average Home Value in this Area
Purchase History
| Date | Buyer | Sale Price | Title Company |
|---|---|---|---|
| Aul Stephen E | -- | Attorney | |
| Aul Stephen E | $78,500 | Dba Sunset Title Services | |
| Gordon Estelle | $28,700 | Hometown Title Agency Inc | |
| Gordon Robert | $90,000 | -- | |
| Wiitanen George L | $100 | -- |
Source: Public Records
Mortgage History
| Date | Status | Borrower | Loan Amount |
|---|---|---|---|
| Previous Owner | Gordon Estelle | $74,150 | |
| Previous Owner | Wiitanen George L | $57,000 |
Source: Public Records
Tax History Compared to Growth
Tax History
| Year | Tax Paid | Tax Assessment Tax Assessment Total Assessment is a certain percentage of the fair market value that is determined by local assessors to be the total taxable value of land and additions on the property. | Land | Improvement |
|---|---|---|---|---|
| 2025 | $3,506 | $205,558 | $38,224 | $167,334 |
| 2024 | $3,506 | $227,121 | $38,224 | $188,897 |
| 2023 | $3,332 | $225,198 | $29,584 | $195,614 |
| 2022 | $2,749 | $192,023 | $24,784 | $167,239 |
| 2021 | $2,339 | $134,677 | $22,243 | $112,434 |
| 2020 | $2,146 | $121,102 | $13,243 | $107,859 |
| 2019 | $1,992 | $109,824 | $13,243 | $96,581 |
| 2018 | $1,776 | $97,578 | $13,243 | $84,335 |
| 2017 | $1,684 | $91,278 | $13,243 | $78,035 |
| 2016 | $1,475 | $74,333 | $13,243 | $61,090 |
| 2015 | $1,381 | $70,849 | $13,243 | $57,606 |
| 2014 | $1,259 | $65,386 | $12,883 | $52,503 |
Source: Public Records
Map
Nearby Homes
- 10600 Mira Vista Dr
- 8215 Autumn Oak Ave
- 10521 Mira Vista Dr
- 8420 Winding Wood Dr
- 10619 Mira Vista Dr
- 8121 Casuarina Dr
- 10331 Basket Oak Dr
- 8421 Unity Dr
- 8101 Casuarina Dr
- 10330 White Cedar St
- 8130 San Felipe Ct
- 8140 San Felipe Ct
- 8040 Pasadena Dr
- 10800 Teer Ln
- 10610 Mosquero Dr
- 10515 Green Meadow Ln
- 8020 Jasmine Blvd
- 10803 Hachita Dr
- 10819 Los Santos Dr
- 10218 Barnett Loop
- 10521 Calico Loop
- 10541 Calico Loop
- 10551 Calico Loop
- 8301 Winding Wood Dr
- 8311 Winding Wood Dr
- 10530 Calico Loop
- 10538 Calico Loop
- 10542 Calico Loop
- 10526 Calico Loop
- 10554 Calico Loop
- 10558 Calico Loop
- 10522 Calico Loop
- 10518 Calico Loop
- 10550 Calico Loop
- 8304 Winding Wood Dr
- 10562 Calico Loop
- 8300 Winding Wood Dr
- 10546 Calico Loop
- 8310 Winding Wood Dr