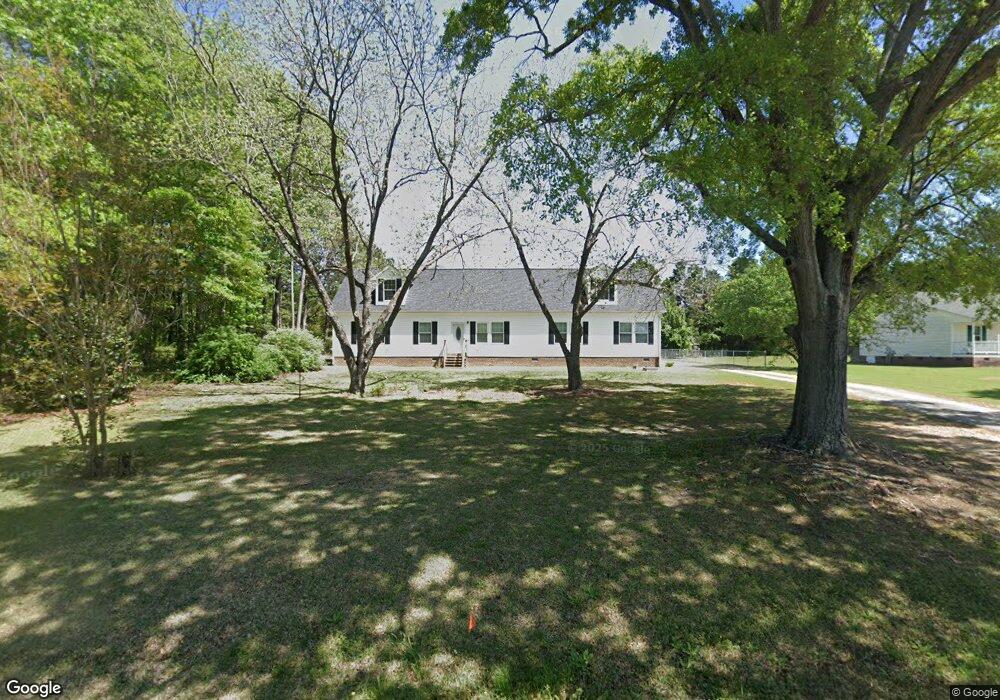
10537 Jordan Rd Raleigh, NC 27603
Estimated Value: $259,000 - $434,000
--
Bed
1
Bath
2,280
Sq Ft
$162/Sq Ft
Est. Value
About This Home
This home is located at 10537 Jordan Rd, Raleigh, NC 27603 and is currently estimated at $370,333, approximately $162 per square foot. 10537 Jordan Rd is a home with nearby schools including North Garner Middle and South Garner High.
Ownership History
Date
Name
Owned For
Owner Type
Purchase Details
Closed on
May 21, 2013
Sold by
Nobling Guynell and Nobling Johnny
Bought by
Nobling Johnny and Nobling Patricia
Current Estimated Value
Purchase Details
Closed on
Jun 6, 2012
Sold by
Nobling Lawrence and Nobling Guynell
Bought by
Nobling Johnny and Nobling Patricia
Purchase Details
Closed on
Aug 20, 1982
Bought by
Nobling Johnny and Nobling Patricia
Create a Home Valuation Report for This Property
The Home Valuation Report is an in-depth analysis detailing your home's value as well as a comparison with similar homes in the area
Home Values in the Area
Average Home Value in this Area
Purchase History
| Date | Buyer | Sale Price | Title Company |
|---|---|---|---|
| Nobling Johnny | -- | None Available | |
| Nobling Johnny | -- | None Available | |
| Nobling Johnny | $1,500 | -- |
Source: Public Records
Tax History Compared to Growth
Tax History
| Year | Tax Paid | Tax Assessment Tax Assessment Total Assessment is a certain percentage of the fair market value that is determined by local assessors to be the total taxable value of land and additions on the property. | Land | Improvement |
|---|---|---|---|---|
| 2025 | $2,958 | $459,288 | $145,000 | $314,288 |
| 2024 | $2,872 | $459,288 | $145,000 | $314,288 |
| 2023 | $2,482 | $315,792 | $76,000 | $239,792 |
| 2022 | $2,301 | $315,792 | $76,000 | $239,792 |
| 2021 | $2,239 | $315,792 | $76,000 | $239,792 |
| 2020 | $2,202 | $315,792 | $76,000 | $239,792 |
| 2019 | $2,004 | $242,938 | $62,000 | $180,938 |
| 2018 | $1,843 | $242,938 | $62,000 | $180,938 |
| 2017 | $1,747 | $242,938 | $62,000 | $180,938 |
| 2016 | $1,712 | $242,938 | $62,000 | $180,938 |
| 2015 | $1,716 | $244,153 | $70,000 | $174,153 |
| 2014 | -- | $129,117 | $70,000 | $59,117 |
Source: Public Records
Map
Nearby Homes
- 1004 Snow Peak Ct
- 1559 Upchurch Woods Dr
- 6109 Oak Passage Dr
- 6257 Oak Passage Dr
- 6009 Swales Way
- 9017 Hunterfox Ct
- 6121 Catandpolly Ln
- 10001 Joe Leach Rd
- 1101 Robinfield Dr
- 6408 Glen Brack Ct
- 6313 Southern Charm Ln
- 5521 Fantasy Moth Dr
- 170 Sallyport Ct
- 408 Johnston Rd
- 1021 Wintu Ct
- 5013 Contender Dr
- 106 Village Ct
- 1004 Cabin Hill Way
- 920 Shadywood Ln
- 1009 Feldmen Dr
- 10549 Jordan Rd
- 10536 Jordan Rd
- 10517 Jordan Rd
- 10601 Hunt Farms Ln
- 10605 Jordan Rd
- 10600 Hunt Farms Ln
- 1400 Upchurch Woods Dr
- 1400 Upchurch Woods Dr Unit LOT58
- 10604 Hunt Farms Ln
- 1401 Upchurch Woods Dr
- 10605 Hunt Farms Ln
- Lot 4 Jordan Rd
- Lot 1 Jordan Rd
- Lot 3 Jordan Rd
- Lot 2 Jordan Rd
- 10800 Jordan Rd
- 0 Jordan Rd Unit N TR1652353
- 0 Jordan Rd Unit N TR1720552
- 0 Jordan Rd Unit TR1837232
- 0 Jordan Rd Unit N 1652353