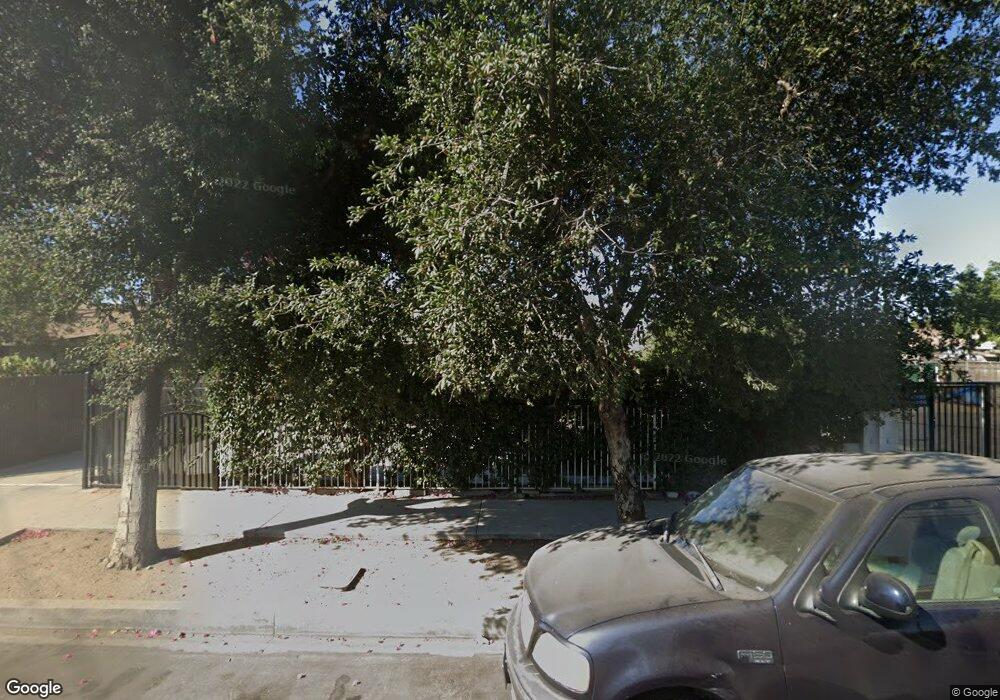
10537 Tamarack Ave Pacoima, CA 91331
Estimated Value: $745,211 - $900,000
4
Beds
2
Baths
1,444
Sq Ft
$551/Sq Ft
Est. Value
About This Home
This home is located at 10537 Tamarack Ave, Pacoima, CA 91331 and is currently estimated at $796,053, approximately $551 per square foot. 10537 Tamarack Ave is a home located in Los Angeles County with nearby schools including Haddon Avenue Elementary School, Pacoima Middle School, and San Fernando Senior High School.
Ownership History
Date
Name
Owned For
Owner Type
Purchase Details
Closed on
Jan 16, 2007
Sold by
Ramirez Delia
Bought by
Ramirez Cesar A
Current Estimated Value
Home Financials for this Owner
Home Financials are based on the most recent Mortgage that was taken out on this home.
Original Mortgage
$472,000
Outstanding Balance
$319,928
Interest Rate
8.87%
Mortgage Type
New Conventional
Estimated Equity
$476,125
Purchase Details
Closed on
Oct 7, 2002
Sold by
Ramirez Cesar and Ramirez Delia
Bought by
Ramirez Cesar A
Home Financials for this Owner
Home Financials are based on the most recent Mortgage that was taken out on this home.
Original Mortgage
$166,500
Interest Rate
6.05%
Purchase Details
Closed on
Sep 26, 1994
Sold by
Francone Mary Louise
Bought by
Ramirez Cesar
Home Financials for this Owner
Home Financials are based on the most recent Mortgage that was taken out on this home.
Original Mortgage
$109,356
Interest Rate
8.58%
Mortgage Type
FHA
Create a Home Valuation Report for This Property
The Home Valuation Report is an in-depth analysis detailing your home's value as well as a comparison with similar homes in the area
Home Values in the Area
Average Home Value in this Area
Purchase History
| Date | Buyer | Sale Price | Title Company |
|---|---|---|---|
| Ramirez Cesar A | -- | Fidelity National Title Co | |
| Ramirez Cesar A | -- | Investors Title Company | |
| Ramirez Cesar | $110,000 | Orange Coast Title |
Source: Public Records
Mortgage History
| Date | Status | Borrower | Loan Amount |
|---|---|---|---|
| Open | Ramirez Cesar A | $472,000 | |
| Closed | Ramirez Cesar A | $166,500 | |
| Closed | Ramirez Cesar | $109,356 |
Source: Public Records
Tax History
| Year | Tax Paid | Tax Assessment Tax Assessment Total Assessment is a certain percentage of the fair market value that is determined by local assessors to be the total taxable value of land and additions on the property. | Land | Improvement |
|---|---|---|---|---|
| 2025 | $3,615 | $286,247 | $103,789 | $182,458 |
| 2024 | $3,562 | $280,635 | $101,754 | $178,881 |
| 2023 | $3,495 | $275,133 | $99,759 | $175,374 |
| 2022 | $3,335 | $269,739 | $97,803 | $171,936 |
| 2021 | $3,288 | $264,451 | $95,886 | $168,565 |
| 2020 | $9,953 | $261,740 | $94,903 | $166,837 |
| 2019 | $9,827 | $256,609 | $93,043 | $163,566 |
| 2018 | $9,723 | $251,578 | $91,219 | $160,359 |
| 2016 | $2,543 | $209,045 | $87,678 | $121,367 |
| 2015 | $2,506 | $205,905 | $86,361 | $119,544 |
| 2014 | $2,520 | $201,873 | $84,670 | $117,203 |
Source: Public Records
Map
Nearby Homes
- 13279 Pierce St
- 10427 Kewen Ave
- 10615 San Fernando Rd
- 10246 Haddon Ave
- 13059 Pierce St
- 13426 Mercer St
- 10397 San Fernando
- 13351 W Celeste Pkwy
- 13369 W Celeste Pkwy
- 13058 Pinney St
- 10315 Amboy Ave
- 13222 Pinney St
- 13402 Terra Bella St
- 13700 Filmore St
- 12985 Kagel Canyon St
- 13447 Filmore St
- 13754 Weidner St
- 13160 Mercer St
- 13511 Terra Bella St
- 13161 Kelowna St
- 10533 Tamarack Ave
- 10543 Tamarack Ave
- 13275 Pierce St
- 10547 Tamarack Ave
- 10551 Tamarack Ave
- 10532 Tamarack Ave
- 10538 Tamarack Ave
- 13274 Pierce St
- 13266 Pierce St
- 10512 Telfair Ave
- 13280 Pierce St
- 10557 Tamarack Ave
- 10544 Tamarack Ave
- 10516 Telfair Ave
- 10506 Telfair Ave
- 10502 Telfair Ave
- 13249 Pierce St
- 13256 Pierce St
- 10550 Tamarack Ave
- 13286 Pierce St
Your Personal Tour Guide
Ask me questions while you tour the home.