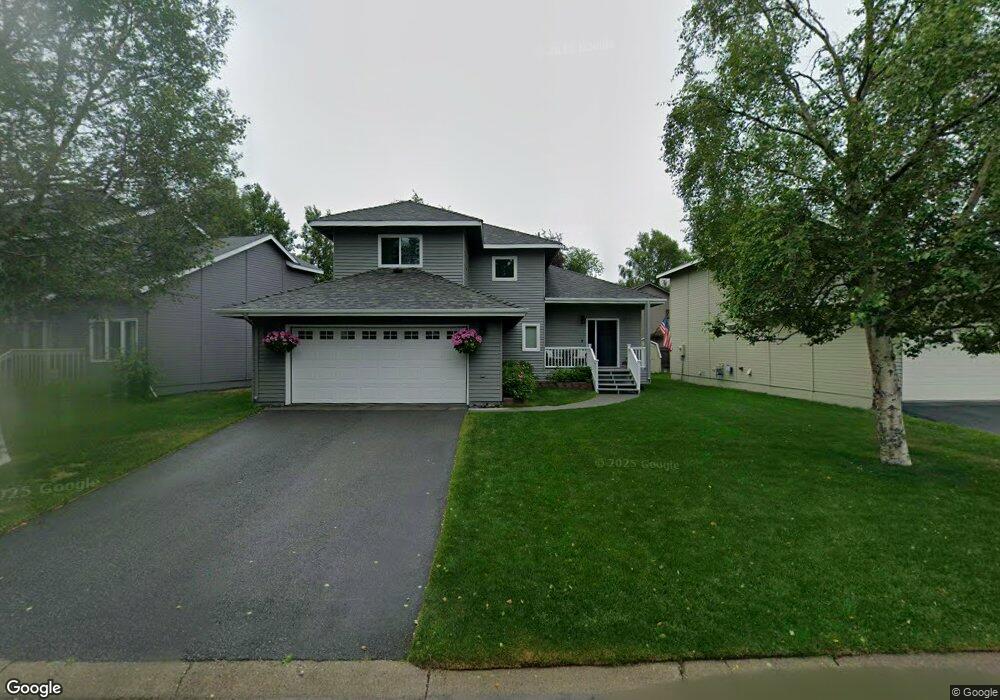
10539 Spindrift Loop Anchorage, AK 99515
Bayshore-Klatt NeighborhoodEstimated Value: $450,000 - $548,000
3
Beds
3
Baths
1,898
Sq Ft
$262/Sq Ft
Est. Value
About This Home
This home is located at 10539 Spindrift Loop, Anchorage, AK 99515 and is currently estimated at $498,121, approximately $262 per square foot. 10539 Spindrift Loop is a home located in Anchorage Municipality with nearby schools including Bayshore Elementary School, Mears Middle School, and Dimond High School.
Ownership History
Date
Name
Owned For
Owner Type
Purchase Details
Closed on
Jul 29, 2009
Sold by
Mccabe Kevin John and Mccabe Linn Marie
Bought by
Larsen Michael T and Larsen Kimberley F
Current Estimated Value
Home Financials for this Owner
Home Financials are based on the most recent Mortgage that was taken out on this home.
Original Mortgage
$288,562
Outstanding Balance
$186,011
Interest Rate
5.31%
Mortgage Type
VA
Estimated Equity
$312,110
Purchase Details
Closed on
Mar 6, 2008
Sold by
Mages Brian A and Mages Tracey M
Bought by
Mccabe Kevin John and Mccabe Linn Marie
Home Financials for this Owner
Home Financials are based on the most recent Mortgage that was taken out on this home.
Original Mortgage
$254,400
Interest Rate
5.41%
Mortgage Type
VA
Purchase Details
Closed on
Nov 7, 2003
Sold by
Martini Eugene R and Martini Janet L
Bought by
Mages Brian A and Mages Tracey M
Home Financials for this Owner
Home Financials are based on the most recent Mortgage that was taken out on this home.
Original Mortgage
$243,750
Interest Rate
5.94%
Mortgage Type
VA
Purchase Details
Closed on
Nov 6, 2003
Sold by
Martini Eugene R and Martini Janet L
Bought by
Mages Brian A and Mages Tracey M
Home Financials for this Owner
Home Financials are based on the most recent Mortgage that was taken out on this home.
Original Mortgage
$243,750
Interest Rate
5.94%
Mortgage Type
VA
Purchase Details
Closed on
Jan 10, 1996
Sold by
Krawietz Thomas E and Krawietz Sherry L
Bought by
Martini Eugene R and Martini Janet L
Home Financials for this Owner
Home Financials are based on the most recent Mortgage that was taken out on this home.
Original Mortgage
$139,400
Interest Rate
7.38%
Mortgage Type
New Conventional
Purchase Details
Closed on
Nov 29, 1988
Sold by
Premiere Development & Construction Inc
Bought by
Krawietz Thomas E and Krawietz Sherry L
Home Financials for this Owner
Home Financials are based on the most recent Mortgage that was taken out on this home.
Original Mortgage
$126,650
Interest Rate
10.38%
Mortgage Type
FHA
Create a Home Valuation Report for This Property
The Home Valuation Report is an in-depth analysis detailing your home's value as well as a comparison with similar homes in the area
Home Values in the Area
Average Home Value in this Area
Purchase History
| Date | Buyer | Sale Price | Title Company |
|---|---|---|---|
| Larsen Michael T | -- | None Available | |
| Mccabe Kevin John | -- | Pnt | |
| Mages Brian A | -- | -- | |
| Mages Brian A | -- | -- | |
| Martini Eugene R | -- | -- | |
| Krawietz Thomas E | -- | -- |
Source: Public Records
Mortgage History
| Date | Status | Borrower | Loan Amount |
|---|---|---|---|
| Open | Larsen Michael T | $288,562 | |
| Previous Owner | Mccabe Kevin John | $254,400 | |
| Previous Owner | Mages Brian A | $243,750 | |
| Previous Owner | Mages Brian A | $243,750 | |
| Previous Owner | Martini Eugene R | $139,400 | |
| Previous Owner | Krawietz Thomas E | $126,650 |
Source: Public Records
Tax History
| Year | Tax Paid | Tax Assessment Tax Assessment Total Assessment is a certain percentage of the fair market value that is determined by local assessors to be the total taxable value of land and additions on the property. | Land | Improvement |
|---|---|---|---|---|
| 2025 | $3,470 | $474,100 | $109,600 | $364,500 |
| 2024 | $3,470 | $439,900 | $97,000 | $342,900 |
| 2023 | $6,758 | $396,800 | $92,700 | $304,100 |
| 2022 | $3,183 | $389,000 | $92,700 | $296,300 |
| 2021 | $6,431 | $356,900 | $92,700 | $264,200 |
| 2020 | $2,515 | $349,100 | $92,700 | $256,400 |
| 2019 | $2,495 | $352,500 | $92,700 | $259,800 |
| 2018 | $2,342 | $342,800 | $92,700 | $250,100 |
| 2017 | $2,654 | $339,500 | $92,700 | $246,800 |
| 2016 | $4,568 | $341,400 | $92,700 | $248,700 |
| 2015 | $4,568 | $337,800 | $93,800 | $244,000 |
| 2014 | $4,568 | $327,400 | $93,100 | $234,300 |
Source: Public Records
Map
Nearby Homes
- 2356 Leander Cir
- L6 B8 Spartan Dr
- L5 B8 Spartan Dr
- 3000 Admiralty Bay Dr
- 10031 Eshamy Bay Dr
- 3017 Bettles Bay Loop
- 3101 Bettles Bay Loop
- 3099 Seclusion Cove Dr Unit 24
- 3121 Marathon Cir
- 10031 Zeus Cir
- 2005 Casey Cusack Loop
- 11402 Discovery Park Dr Unit 16B
- 11500 Jennifer Ann Cir
- 9520 Albatross Dr
- 9561 Canton Loop Unit 174
- 3340 Lakeside Dr
- 9468 Canton Loop Unit 158
- 2855 Diligence Cir
- 2542 Curlew Cir Unit 5
- 3511 Amber Bay Loop
- 10545 Spindrift Loop
- 10533 Spindrift Loop
- 10524 Northfleet Dr
- 10551 Spindrift Loop
- 10527 Spindrift Loop
- 10534 Northfleet Dr
- 10514 Northfleet Dr
- 10538 Spindrift Loop
- 10544 Northfleet Dr
- 10542 Spindrift Loop
- 10521 Spindrift Loop
- 10534 Spindrift Loop
- 10557 Spindrift Loop
- 10546 Spindrift Loop
- 10530 Spindrift Loop
- 10550 Spindrift Loop
- 10563 Spindrift Loop
- 10526 Spindrift Loop
- 10569 Spindrift Loop
- 10556 Spindrift Loop
Your Personal Tour Guide
Ask me questions while you tour the home.