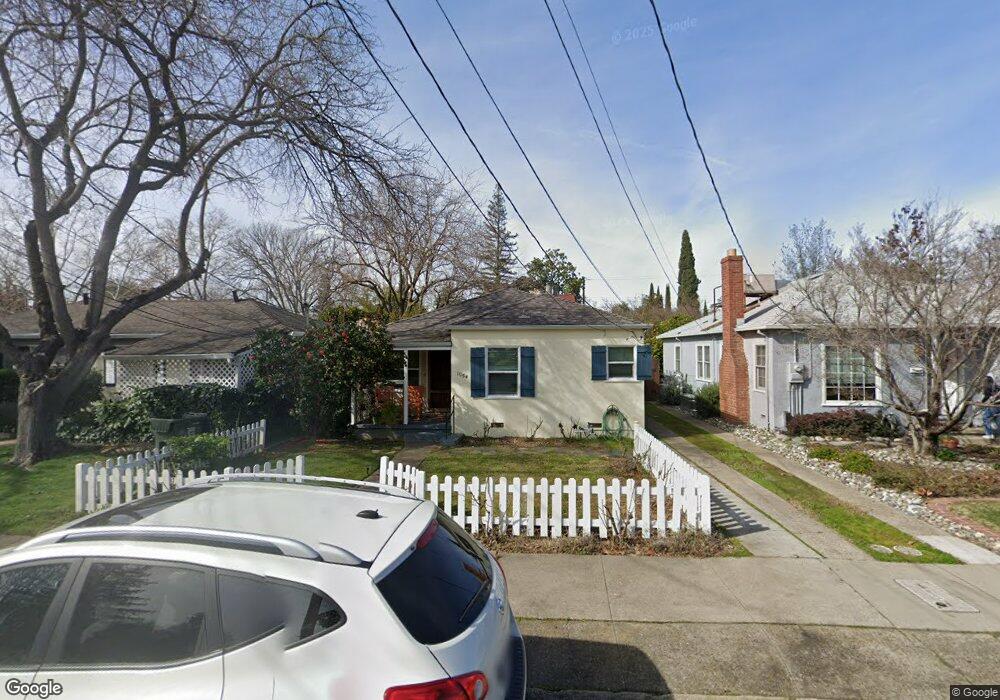
1054 49th St Sacramento, CA 95819
East Sacramento NeighborhoodEstimated Value: $461,000 - $581,000
2
Beds
1
Bath
856
Sq Ft
$626/Sq Ft
Est. Value
About This Home
This home is located at 1054 49th St, Sacramento, CA 95819 and is currently estimated at $536,193, approximately $626 per square foot. 1054 49th St is a home located in Sacramento County with nearby schools including Caleb Greenwood Elementary, Umoja International Academy, and Hiram W. Johnson High School.
Ownership History
Date
Name
Owned For
Owner Type
Purchase Details
Closed on
Mar 20, 2014
Sold by
Carlsmith Bruce Stephen and Putnam Lisa Ann
Bought by
Carlsmith & Putnam Properties Llc
Current Estimated Value
Purchase Details
Closed on
Aug 27, 2013
Sold by
Putnam Lisa and Carlsmith Bruce
Bought by
Carlsmith Bruce Stephen and Putman Lisa Ann
Purchase Details
Closed on
Dec 26, 2012
Sold by
Putnam Lisa and Carlsmith Bruce
Bought by
Putnam Lisa Ann and Carlsmith Bruce Stephen
Purchase Details
Closed on
Sep 2, 2002
Sold by
Bryant Robert K and Charles W Bryant Trust
Bought by
Putnam Lisa and Carlsmith Bruce
Create a Home Valuation Report for This Property
The Home Valuation Report is an in-depth analysis detailing your home's value as well as a comparison with similar homes in the area
Home Values in the Area
Average Home Value in this Area
Purchase History
| Date | Buyer | Sale Price | Title Company |
|---|---|---|---|
| Carlsmith & Putnam Properties Llc | -- | None Available | |
| Carlsmith Bruce Stephen | -- | None Available | |
| Putnam Lisa Ann | -- | None Available | |
| Putnam Lisa | $212,500 | Stewart Title |
Source: Public Records
Tax History Compared to Growth
Tax History
| Year | Tax Paid | Tax Assessment Tax Assessment Total Assessment is a certain percentage of the fair market value that is determined by local assessors to be the total taxable value of land and additions on the property. | Land | Improvement |
|---|---|---|---|---|
| 2025 | $3,629 | $307,752 | $117,305 | $190,447 |
| 2024 | $3,629 | $301,718 | $115,005 | $186,713 |
| 2023 | $3,543 | $295,802 | $112,750 | $183,052 |
| 2022 | $3,483 | $290,003 | $110,540 | $179,463 |
| 2021 | $3,318 | $284,318 | $108,373 | $175,945 |
| 2020 | $3,346 | $281,403 | $107,262 | $174,141 |
| 2019 | $3,275 | $275,886 | $105,159 | $170,727 |
| 2018 | $3,190 | $270,478 | $103,098 | $167,380 |
| 2017 | $3,145 | $265,176 | $101,077 | $164,099 |
| 2016 | $3,072 | $259,978 | $99,096 | $160,882 |
| 2015 | $3,027 | $256,074 | $97,608 | $158,466 |
| 2014 | $2,945 | $251,058 | $95,696 | $155,362 |
Source: Public Records
Map
Nearby Homes