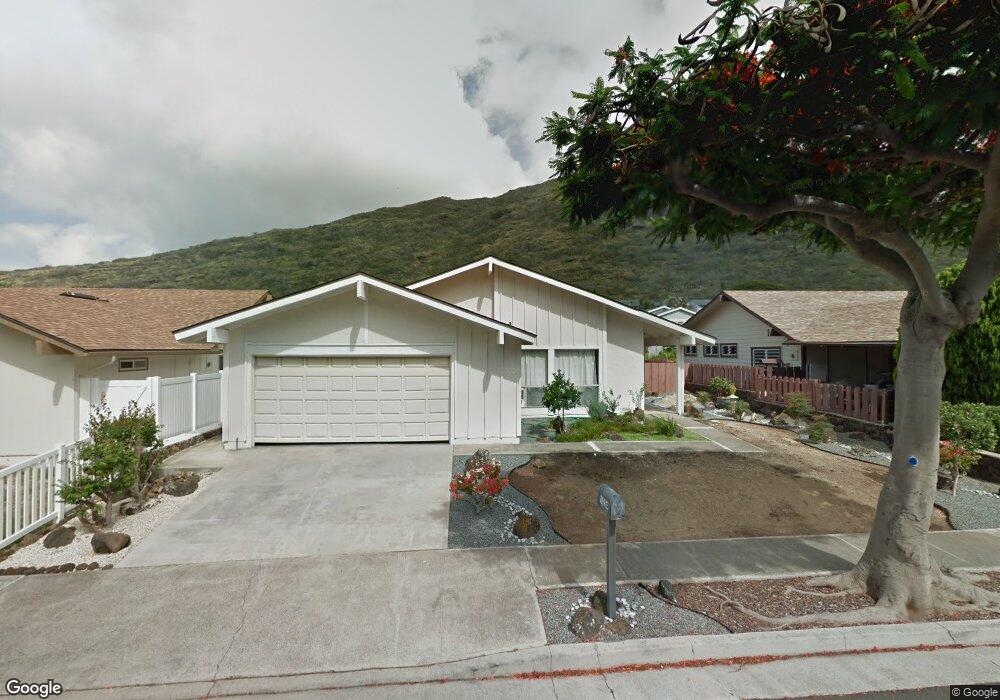
1054 Awawamalu St Unit D Honolulu, HI 96825
Hawaii Kai NeighborhoodEstimated Value: $708,478 - $830,000
2
Beds
1
Bath
850
Sq Ft
$887/Sq Ft
Est. Value
About This Home
This home is located at 1054 Awawamalu St Unit D, Honolulu, HI 96825 and is currently estimated at $754,370, approximately $887 per square foot. 1054 Awawamalu St Unit D is a home located in Honolulu County with nearby schools including Kamiloiki Elementary School and Niu Valley Middle School.
Ownership History
Date
Name
Owned For
Owner Type
Purchase Details
Closed on
Jul 8, 2021
Sold by
Simic Denee
Bought by
Denee A Simic Revocable Living Trust and Simic
Current Estimated Value
Purchase Details
Closed on
Mar 25, 2010
Sold by
Simic Denee and Ogden Eloise
Bought by
Simic Denee
Home Financials for this Owner
Home Financials are based on the most recent Mortgage that was taken out on this home.
Original Mortgage
$292,500
Interest Rate
4.88%
Mortgage Type
New Conventional
Purchase Details
Closed on
Dec 18, 2002
Sold by
Kim Rowan and Simic Denee
Bought by
Simic Denee and Ogden Eloise
Home Financials for this Owner
Home Financials are based on the most recent Mortgage that was taken out on this home.
Original Mortgage
$175,000
Interest Rate
4.75%
Create a Home Valuation Report for This Property
The Home Valuation Report is an in-depth analysis detailing your home's value as well as a comparison with similar homes in the area
Home Values in the Area
Average Home Value in this Area
Purchase History
| Date | Buyer | Sale Price | Title Company |
|---|---|---|---|
| Denee A Simic Revocable Living Trust | -- | None Listed On Document | |
| Simic Denee A | -- | None Available | |
| Simic Denee A | -- | None Available | |
| Simic Denee A | -- | None Available | |
| Simic Denee | -- | Fam | |
| Simic Denee | -- | Fidelity National Title Ins |
Source: Public Records
Mortgage History
| Date | Status | Borrower | Loan Amount |
|---|---|---|---|
| Previous Owner | Simic Denee | $292,500 | |
| Previous Owner | Simic Denee | $175,000 |
Source: Public Records
Tax History Compared to Growth
Tax History
| Year | Tax Paid | Tax Assessment Tax Assessment Total Assessment is a certain percentage of the fair market value that is determined by local assessors to be the total taxable value of land and additions on the property. | Land | Improvement |
|---|---|---|---|---|
| 2025 | $1,429 | $617,700 | $334,200 | $283,500 |
| 2024 | $1,429 | $568,200 | $334,200 | $234,000 |
| 2023 | $863 | $486,500 | $334,200 | $152,300 |
| 2022 | $1,325 | $518,700 | $334,200 | $184,500 |
| 2021 | $1,398 | $539,300 | $334,200 | $205,100 |
| 2020 | $1,443 | $552,300 | $334,200 | $218,100 |
| 2019 | $1,620 | $542,900 | $334,200 | $208,700 |
| 2018 | $1,420 | $485,700 | $334,200 | $151,500 |
| 2017 | $1,351 | $465,900 | $334,200 | $131,700 |
| 2016 | $1,276 | $444,700 | $334,200 | $110,500 |
| 2015 | $1,247 | $436,300 | $334,200 | $102,100 |
| 2014 | $1,006 | $421,000 | $334,200 | $86,800 |
Source: Public Records
Map
Nearby Homes
- 1125 Wainiha St Unit D
- 1136 Kumukumu St Unit D
- 123 Waihili Place
- 1062 Hoa St
- 1205 Lunalilo Home Rd
- 1327 Kamehame Dr
- 00 Kamehame Dr
- 1007 Hanohano Way
- 132 Hoolako Place
- 7440 Kamehame Place
- 1262 Pihana St
- 7533 Kamaomao Place
- 7223 Naohe St
- 823 Kalalea St
- 7540 Puumahoe Place
- 7227 Pikoni Place
- 649 Kealahou St
- 120 & 128 Hanapepe Loop
- 790 Ipuai St
- 1361 Honokahua St
- 1054 Awawamalu St Unit B
- 1054 Awawamalu St Unit A
- 1054 Awawamalu St Unit C
- 1050 Awawamalu St Unit A
- 1050 Awawamalu St Unit C
- 1050 Awawamalu St Unit B
- 1050 Awawamalu St Unit C
- 1058 Awawamalu St Unit A
- 1058 Awawamalu St Unit D
- 1058 Awawamalu St Unit E
- 1058 Awawamalu St Unit C
- 1058 Awawamalu St Unit B
- 1131 Wainiha St Unit C
- 1131 Wainiha St Unit E
- 1131 Wainiha St Unit A
- 1131 Wainiha St Unit F
- 1131 Wainiha St Unit D
- 1060 Awawamalu St Unit B
- 1060 Awawamalu St Unit C
- 1060 Awawamalu St Unit A