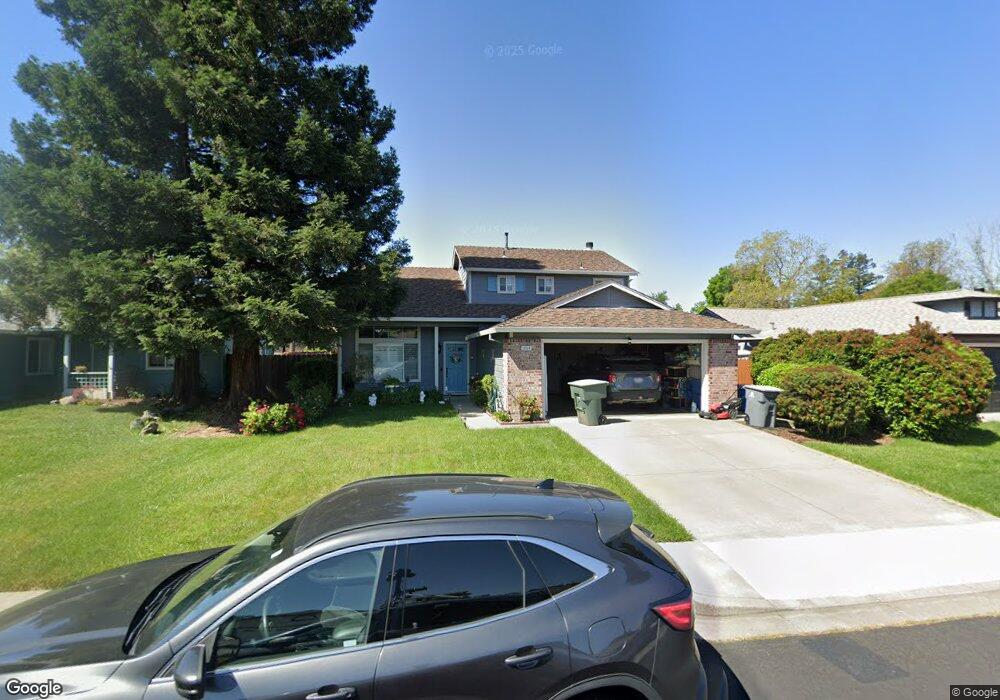
1054 Cinnabar Way Vacaville, CA 95687
Estimated Value: $589,000 - $602,000
4
Beds
3
Baths
1,689
Sq Ft
$352/Sq Ft
Est. Value
About This Home
This home is located at 1054 Cinnabar Way, Vacaville, CA 95687 and is currently estimated at $595,142, approximately $352 per square foot. 1054 Cinnabar Way is a home located in Solano County with nearby schools including Foxboro Elementary School, Golden West Middle School, and Vanden High School.
Ownership History
Date
Name
Owned For
Owner Type
Purchase Details
Closed on
Oct 10, 1997
Sold by
Rodriguez Jorge A and Rodriguez Julia C
Bought by
Rodriguez Jorge A and Rodriguez Julia C
Current Estimated Value
Home Financials for this Owner
Home Financials are based on the most recent Mortgage that was taken out on this home.
Original Mortgage
$62,000
Interest Rate
7.23%
Purchase Details
Closed on
Mar 20, 1996
Sold by
Lewis Homes Of California
Bought by
Rodriguiz Jorge A and Rodriguez Julia C
Home Financials for this Owner
Home Financials are based on the most recent Mortgage that was taken out on this home.
Original Mortgage
$149,847
Interest Rate
7.05%
Mortgage Type
FHA
Purchase Details
Closed on
Mar 5, 1996
Sold by
Perla Maria
Bought by
Perla Jose
Home Financials for this Owner
Home Financials are based on the most recent Mortgage that was taken out on this home.
Original Mortgage
$149,847
Interest Rate
7.05%
Mortgage Type
FHA
Create a Home Valuation Report for This Property
The Home Valuation Report is an in-depth analysis detailing your home's value as well as a comparison with similar homes in the area
Home Values in the Area
Average Home Value in this Area
Purchase History
| Date | Buyer | Sale Price | Title Company |
|---|---|---|---|
| Rodriguez Jorge A | -- | United Title | |
| Rodriguiz Jorge A | $153,000 | First American Title Guarant | |
| Perla Jose | -- | First American Title Guarant |
Source: Public Records
Mortgage History
| Date | Status | Borrower | Loan Amount |
|---|---|---|---|
| Closed | Rodriguez Jorge A | $62,000 | |
| Previous Owner | Rodriguiz Jorge A | $149,847 |
Source: Public Records
Tax History Compared to Growth
Tax History
| Year | Tax Paid | Tax Assessment Tax Assessment Total Assessment is a certain percentage of the fair market value that is determined by local assessors to be the total taxable value of land and additions on the property. | Land | Improvement |
|---|---|---|---|---|
| 2025 | $3,535 | $255,831 | $83,062 | $172,769 |
| 2024 | $3,535 | $250,816 | $81,434 | $169,382 |
| 2023 | $3,435 | $245,899 | $79,838 | $166,061 |
| 2022 | $3,356 | $241,078 | $78,273 | $162,805 |
| 2021 | $3,353 | $236,352 | $76,739 | $159,613 |
| 2020 | $3,325 | $233,930 | $75,953 | $157,977 |
| 2019 | $3,256 | $229,344 | $74,464 | $154,880 |
| 2018 | $3,204 | $224,848 | $73,004 | $151,844 |
| 2017 | $3,105 | $220,440 | $71,573 | $148,867 |
| 2016 | $3,058 | $216,119 | $70,170 | $145,949 |
| 2015 | $3,023 | $212,873 | $69,116 | $143,757 |
| 2014 | $2,978 | $208,704 | $67,763 | $140,941 |
Source: Public Records
Map
Nearby Homes
- 355 Zachary Dr
- 845 Turquoise St
- 790 Morissette Way
- 917 Turquoise St
- 231 Park Ln
- 309 Nancy Ln
- 224 Park Ln
- 115 American Way
- 921 Topaz Cir
- 196 Caldwell Dr
- 773 Peregrine Way
- 925 Cloverbrook Cir
- 918 Moonstone Ct
- 137 Marna Dr
- 165 Audrey Place
- 3510 Nut Tree Rd
- 805 Broadfork Cir
- 2031 Newcastle Dr
- 644 Canterbury Cir
- 4054 Camden Ct
- 1060 Cinnabar Way
- 1048 Cinnabar Way
- 1042 Cinnabar Way
- 1061 Cinnabar Way
- 1055 Cinnabar Way
- 1067 Cinnabar Way
- 1072 Cinnabar Way
- 1049 Cinnabar Way
- 1036 Cinnabar Way
- 1043 Cinnabar Way
- 1073 Cinnabar Way
- 1078 Cinnabar Way
- 1030 Cinnabar Way
- 371 Marna Dr
- 377 Marna Dr
- 855 Flint Way
- 861 Flint Way
- 365 Marna Dr
- 1037 Cinnabar Way