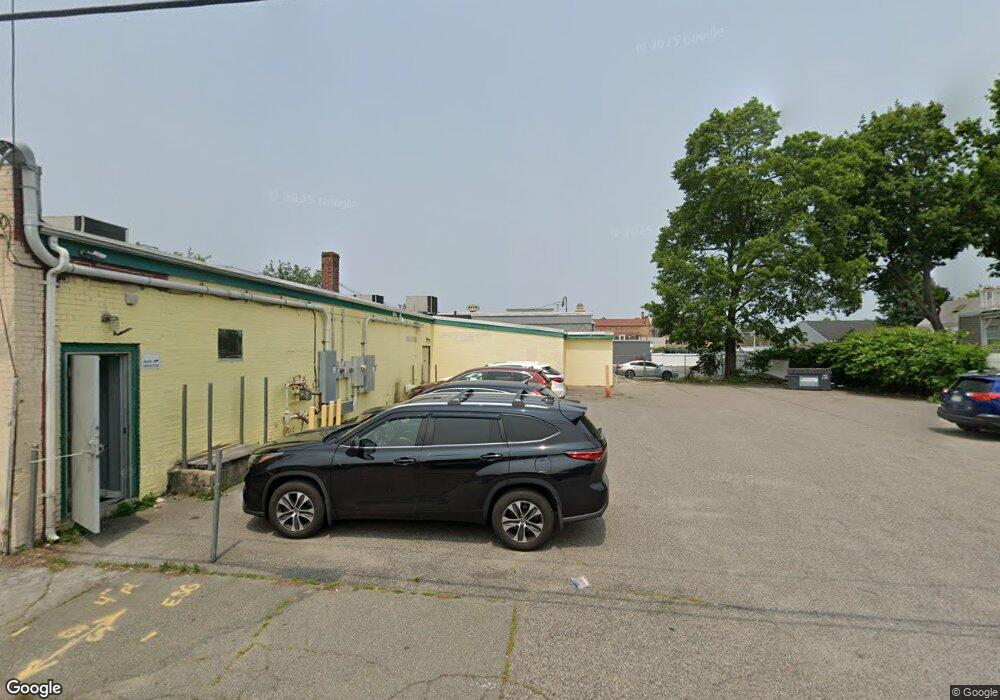
1054 Main St Brockton, MA 02301
Clifton Heights NeighborhoodEstimated Value: $633,142
--
Bed
--
Bath
6,972
Sq Ft
$91/Sq Ft
Est. Value
About This Home
This home is located at 1054 Main St, Brockton, MA 02301 and is currently estimated at $633,142, approximately $90 per square foot. 1054 Main St is a home located in Plymouth County with nearby schools including Davis K-8 School, John F. Kennedy Elementary School, and South Middle School.
Ownership History
Date
Name
Owned For
Owner Type
Purchase Details
Closed on
Jul 12, 2023
Sold by
Henry H Nguyen Llc
Bought by
Gm Property Invs Llc
Current Estimated Value
Home Financials for this Owner
Home Financials are based on the most recent Mortgage that was taken out on this home.
Original Mortgage
$370,000
Outstanding Balance
$360,439
Interest Rate
6.79%
Mortgage Type
Purchase Money Mortgage
Estimated Equity
$272,703
Purchase Details
Closed on
Feb 27, 2013
Sold by
Nguyen Loan P
Bought by
Henry H Nguyen Llc
Purchase Details
Closed on
May 18, 2012
Sold by
Huynh Aaron P
Bought by
Nguyen Loan P
Purchase Details
Closed on
Jan 10, 2012
Sold by
Obiora Chinedu
Bought by
Nguyen Loan P and Huynh Aaron P
Purchase Details
Closed on
May 30, 2002
Sold by
Brockton City Of
Bought by
Nwaka Ifeoma
Purchase Details
Closed on
Apr 24, 1995
Sold by
Brocktune Inc
Bought by
Melodye Lounge Rt and Sarafoglou
Create a Home Valuation Report for This Property
The Home Valuation Report is an in-depth analysis detailing your home's value as well as a comparison with similar homes in the area
Home Values in the Area
Average Home Value in this Area
Purchase History
| Date | Buyer | Sale Price | Title Company |
|---|---|---|---|
| Gm Property Invs Llc | $580,000 | None Available | |
| Henry H Nguyen Llc | $180,000 | -- | |
| Henry H Nguyen Llc | $180,000 | -- | |
| Nguyen Loan P | -- | -- | |
| Nguyen Loan P | -- | -- | |
| Nguyen Loan P | -- | -- | |
| Nguyen Loan P | $175,000 | -- | |
| Nwaka Ifeoma | $131,000 | -- | |
| Nwaka Ifeoma | $131,000 | -- | |
| Melodye Lounge Rt | $47,000 | -- | |
| Brocktune Inc | $47,000 | -- | |
| Brocktune Inc | $47,000 | -- |
Source: Public Records
Mortgage History
| Date | Status | Borrower | Loan Amount |
|---|---|---|---|
| Open | Gm Property Invs Llc | $370,000 | |
| Previous Owner | Brocktune Inc | $119,913 | |
| Previous Owner | Brocktune Inc | $281,790 |
Source: Public Records
Tax History Compared to Growth
Tax History
| Year | Tax Paid | Tax Assessment Tax Assessment Total Assessment is a certain percentage of the fair market value that is determined by local assessors to be the total taxable value of land and additions on the property. | Land | Improvement |
|---|---|---|---|---|
| 2025 | $10,038 | $414,800 | $166,500 | $248,300 |
| 2024 | $7,708 | $320,500 | $151,400 | $169,100 |
| 2023 | $7,580 | $291,300 | $130,300 | $161,000 |
| 2022 | $7,428 | $263,600 | $130,300 | $133,300 |
| 2021 | $7,454 | $251,500 | $124,100 | $127,400 |
| 2020 | $7,648 | $251,500 | $118,200 | $133,300 |
| 2019 | $7,613 | $240,400 | $118,200 | $122,200 |
| 2018 | $7,819 | $235,300 | $118,200 | $117,100 |
| 2017 | $7,586 | $230,300 | $118,200 | $112,100 |
| 2016 | $6,993 | $218,400 | $118,220 | $100,180 |
| 2015 | $7,399 | $218,400 | $118,220 | $100,180 |
| 2014 | $7,417 | $218,400 | $118,220 | $100,180 |
Source: Public Records
Map
Nearby Homes
- 12 E Chestnut St
- 12 E Chestnut St Unit 2
- 12 E Chestnut St Unit 1
- 16 E Chestnut St Unit 1
- 16 E Chestnut St Unit 2
- 16 E Chestnut St
- 18 E Chestnut St
- 4 Northfield St
- 00 W Chestnut St
- 1049 Main St
- 1049 Main St Unit 3
- 1049 Main St Unit C
- 1049 Main St Unit 2
- 1049 Main St
- 1047 Main St
- 1061 Main St
- 1040 Main St
- 1073 Main St
- 15 E Chestnut St Unit 2
- 15 E Chestnut St