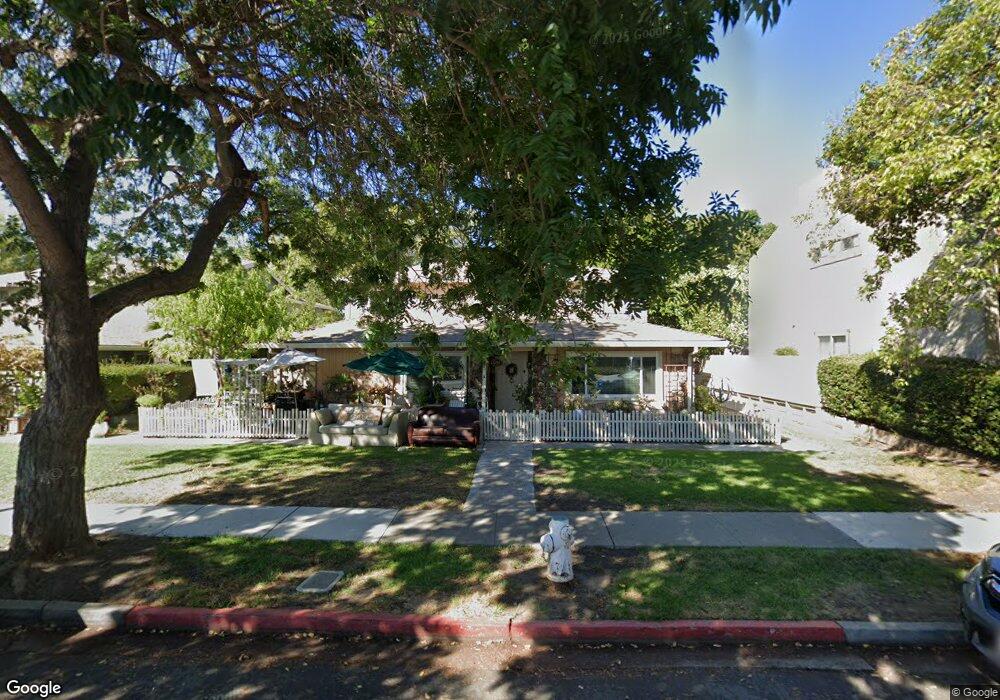
1054 Mohr Ln Unit D Concord, CA 94518
Tree Haven NeighborhoodEstimated Value: $321,000 - $333,330
2
Beds
1
Bath
854
Sq Ft
$383/Sq Ft
Est. Value
About This Home
This home is located at 1054 Mohr Ln Unit D, Concord, CA 94518 and is currently estimated at $327,083, approximately $383 per square foot. 1054 Mohr Ln Unit D is a home located in Contra Costa County with nearby schools including Fair Oaks Elementary School, Oak Grove Middle School, and Ygnacio Valley High School.
Ownership History
Date
Name
Owned For
Owner Type
Purchase Details
Closed on
Aug 1, 2007
Sold by
Weitzman David M
Bought by
Dmw Rental Properties Llc
Current Estimated Value
Purchase Details
Closed on
Jan 20, 2000
Sold by
Weitzman David M
Bought by
Weitzman David M
Purchase Details
Closed on
Oct 15, 1999
Sold by
Menjivar Mario E and Menjivar Efrain A
Bought by
Weitzman David M
Home Financials for this Owner
Home Financials are based on the most recent Mortgage that was taken out on this home.
Original Mortgage
$65,600
Interest Rate
7.37%
Mortgage Type
Purchase Money Mortgage
Purchase Details
Closed on
Oct 13, 1999
Sold by
Dobel Kathryn E
Bought by
Weitzman David M
Home Financials for this Owner
Home Financials are based on the most recent Mortgage that was taken out on this home.
Original Mortgage
$65,600
Interest Rate
7.37%
Mortgage Type
Purchase Money Mortgage
Create a Home Valuation Report for This Property
The Home Valuation Report is an in-depth analysis detailing your home's value as well as a comparison with similar homes in the area
Home Values in the Area
Average Home Value in this Area
Purchase History
| Date | Buyer | Sale Price | Title Company |
|---|---|---|---|
| Dmw Rental Properties Llc | -- | None Available | |
| Weitzman David M | -- | -- | |
| Weitzman David M | $82,500 | First California Title Compa | |
| Menjivar Mario E | -- | First California Title Compa | |
| Weitzman David M | -- | First California Title Compa |
Source: Public Records
Mortgage History
| Date | Status | Borrower | Loan Amount |
|---|---|---|---|
| Previous Owner | Weitzman David M | $65,600 |
Source: Public Records
Tax History Compared to Growth
Tax History
| Year | Tax Paid | Tax Assessment Tax Assessment Total Assessment is a certain percentage of the fair market value that is determined by local assessors to be the total taxable value of land and additions on the property. | Land | Improvement |
|---|---|---|---|---|
| 2025 | $2,308 | $126,778 | $23,044 | $103,734 |
| 2024 | $2,242 | $124,293 | $22,593 | $101,700 |
| 2023 | $2,242 | $121,856 | $22,150 | $99,706 |
| 2022 | $2,187 | $119,467 | $21,716 | $97,751 |
| 2021 | $2,114 | $117,126 | $21,291 | $95,835 |
| 2019 | $2,058 | $113,654 | $20,660 | $92,994 |
| 2018 | $1,968 | $111,426 | $20,255 | $91,171 |
| 2017 | $1,885 | $109,242 | $19,858 | $89,384 |
| 2016 | $1,804 | $107,101 | $19,469 | $87,632 |
| 2015 | $1,749 | $105,493 | $19,177 | $86,316 |
| 2014 | $1,688 | $103,428 | $18,802 | $84,626 |
Source: Public Records
Map
Nearby Homes
- 1356 Del Rio Cir Unit D
- 1064 Mohr Ln Unit C
- 1369 Del Rio Cir Unit C
- 1040 Mohr Ln
- 1038 Mohr Ln Unit A
- 1076 Mohr Ln Unit B
- 1459 Del Rio Cir Unit C
- 1096 Mohr Ln
- 1091 Mohr Ln Unit D
- 134 The Trees Dr
- 1086 Azalea Ln
- 1024 Bermuda Dr
- 136 Cleopatra Dr
- 1781 Gilardy Dr
- 1509 Wicket Ct
- 1420 Pear Dr
- 1271 Hookston Rd
- 1751 Whitman Rd
- 1218 Hookston Rd
- 1110 Eureka Ln
- 1054 Mohr Ln Unit C
- 1054 Mohr Ln Unit B
- 1054 Mohr Ln Unit A
- 1050b Mohr Ln
- 1056 Mohr Ln Unit D
- 1056 Mohr Ln Unit C
- 1056 Mohr Ln Unit B
- 1056 Mohr Ln Unit A
- 1058 Mohr Ln Unit D
- 1058 Mohr Ln Unit C
- 1058 Mohr Ln Unit B
- 1058 Mohr Ln Unit A
- 1050 Mohr Ln Unit F
- 1050 Mohr Ln Unit E
- 1050 Mohr Ln Unit D
- 1050 Mohr Ln Unit C
- 1050 Mohr Ln Unit B
- 1073 Mohr Ln Unit D
- 1073 Mohr Ln Unit C
- 1073 Mohr Ln Unit B