
Landlord's Agent in 2023
Danica Wysocki
M.O. Wilson Properties
(703) 888-9440


Estimated Value: $283,198 - $305,000
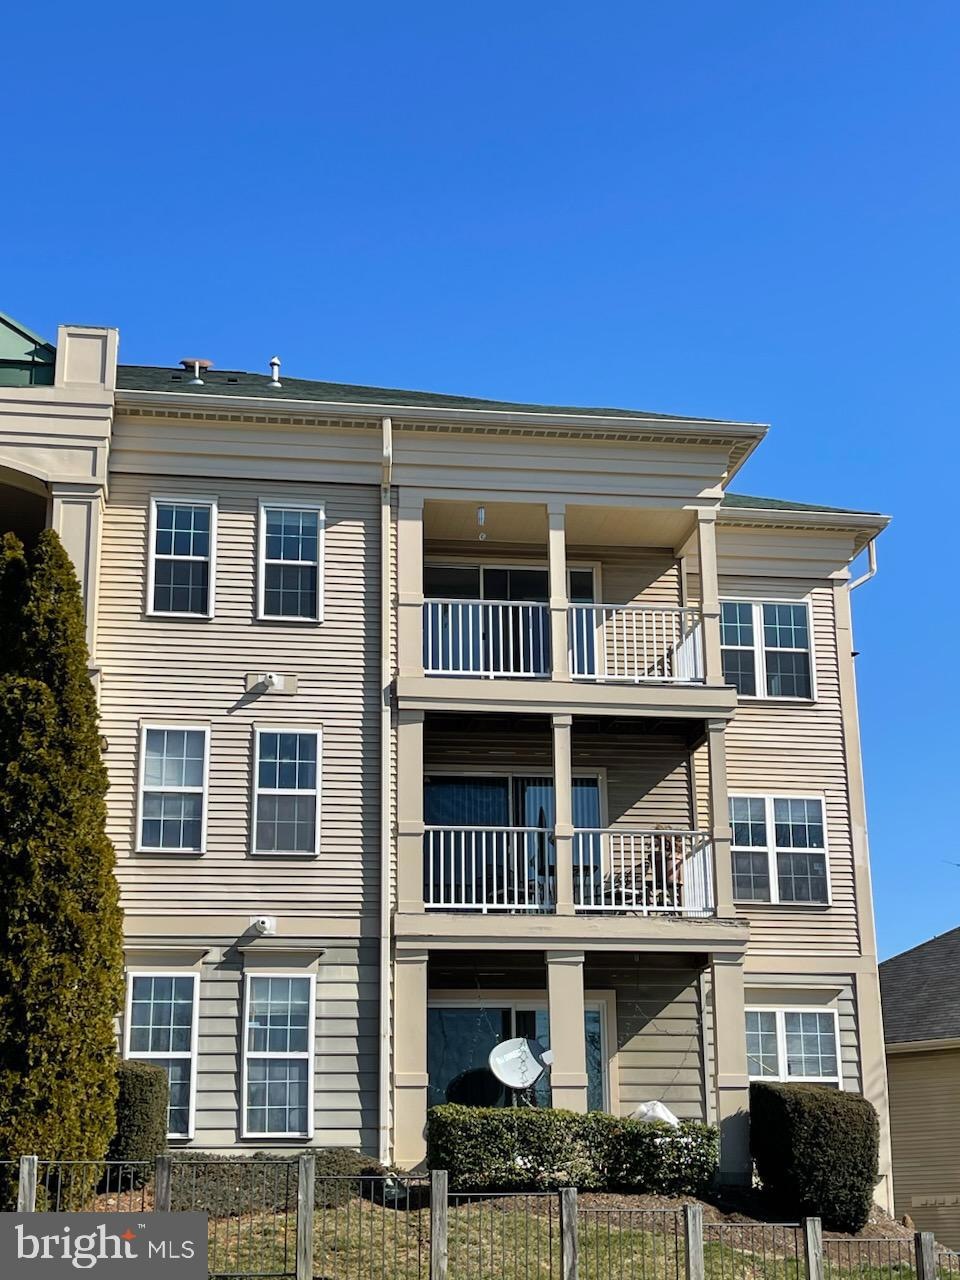
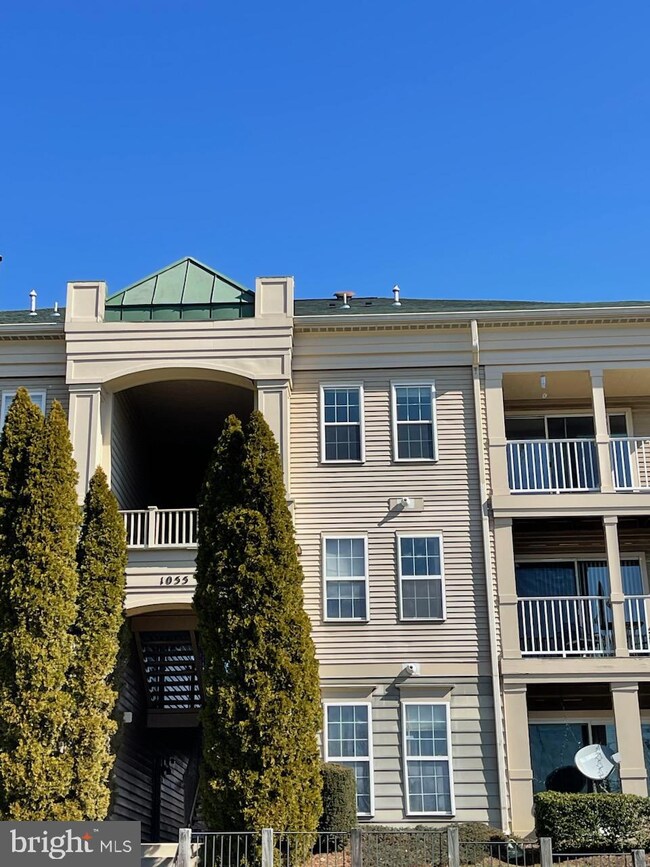
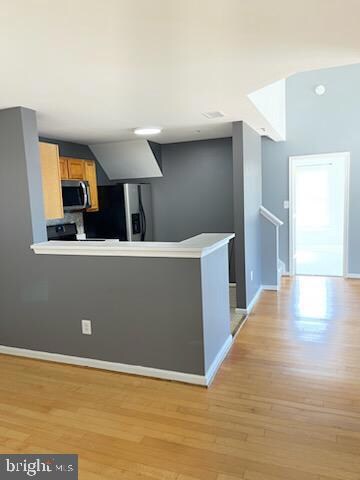
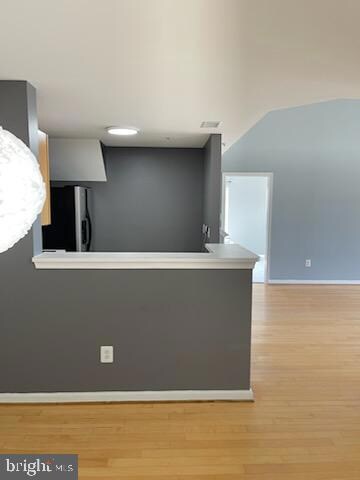
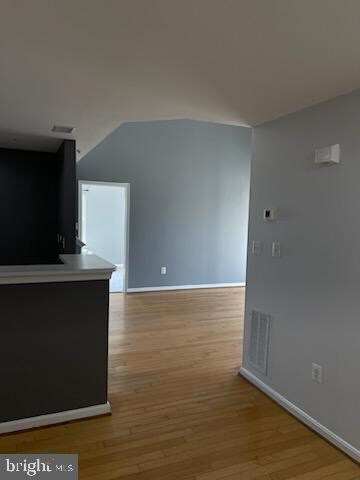
3 Bedrooms(3 br NTC), 3 Full Bath, Spacious Finished Loft With Full Bath & Closet Can Use As 3rd Bedroom, Each Room Has it's Own Bath, Hardwood Floor in Foyer, Dining & Living Area Leads To Balcony For A Nice View, Tiles in Kitchen, S/Steel Appliances, Washer & Dryer in Unit. Great location with easy access to i95, rt1, and shopping.
Last Agent to Rent the Property
(703) 888-9440 dwysocki03@outlook.com M.O. Wilson Properties Listed on: 02/22/2023
| Date | Buyer | Sale Price | Title Company |
|---|---|---|---|
| Sullins Nolan Payne | -- | Fidelity National Title Ins | |
| Veney Deidre A | $85,000 | -- | |
| Sullins Nolan P | $80,490 | -- |
| Date | Status | Borrower | Loan Amount |
|---|---|---|---|
| Open | Sullins Nolan Payne | $101,250 | |
| Previous Owner | Sullins Nolan P | $86,700 | |
| Previous Owner | Sullins Nolan P | $78,650 |
| Date | Event | Price | List to Sale | Price per Sq Ft | Prior Sale |
|---|---|---|---|---|---|
| 03/07/2023 03/07/23 | Rented | $2,100 | 0.0% | -- | |
| 03/03/2023 03/03/23 | Under Contract | -- | -- | -- | |
| 02/22/2023 02/22/23 | For Rent | $2,100 | 0.0% | -- | |
| 01/15/2019 01/15/19 | For Sale | $154,000 | 0.0% | $164 / Sq Ft | |
| 09/12/2018 09/12/18 | Sold | $154,000 | -- | $164 / Sq Ft | View Prior Sale |
| 08/29/2018 08/29/18 | Pending | -- | -- | -- |
| Year | Tax Paid | Tax Assessment Tax Assessment Total Assessment is a certain percentage of the fair market value that is determined by local assessors to be the total taxable value of land and additions on the property. | Land | Improvement |
|---|---|---|---|---|
| 2025 | $2,483 | $263,300 | $85,100 | $178,200 |
| 2024 | $2,483 | $249,700 | $81,000 | $168,700 |
| 2023 | $2,392 | $229,900 | $74,300 | $155,600 |
| 2022 | $2,326 | $210,000 | $67,500 | $142,500 |
| 2021 | $2,419 | $195,600 | $62,500 | $133,100 |
| 2020 | $2,716 | $175,200 | $44,300 | $130,900 |
| 2019 | $2,674 | $172,500 | $43,900 | $128,600 |
| 2018 | $1,769 | $146,500 | $45,400 | $101,100 |
| 2017 | $1,718 | $136,000 | $36,600 | $99,400 |
| 2016 | $1,718 | $137,400 | $36,800 | $100,600 |
| 2015 | $1,485 | $132,200 | $35,400 | $96,800 |
| 2014 | $1,485 | $115,400 | $31,500 | $83,900 |
Landlord's Agent in 2023
Danica Wysocki
M.O. Wilson Properties
(703) 888-9440
Tenant's Agent in 2023
Rachel Lima
KW United
(703) 278-2679
50 Total Sales
Seller's Agent in 2019
Jessica Legarreta
Samson Properties
(540) 207-1883
17 Total Sales
Buyer's Agent in 2019
Javed Baig
Prince William Realty Inc.
(703) 497-6000
25 Total Sales
Source: Bright MLS
MLS Number: VAPW2045634
APN: 8392-34-3927.02
Disclaimer: Certain information contained herein is derived from information provided by parties other than Homes.com. All information provided is deemed reliable, but is not guaranteed to be accurate and should be independently verified.
![]() The data relating to real estate for sale on this website appears in part through the BRIGHT Internet Data Exchange program, a voluntary cooperative exchange of property listing data between licensed real estate brokerage firms, and is provided by BRIGHT through a licensing agreement.
The data relating to real estate for sale on this website appears in part through the BRIGHT Internet Data Exchange program, a voluntary cooperative exchange of property listing data between licensed real estate brokerage firms, and is provided by BRIGHT through a licensing agreement.
Listing information is from various brokers who participate in the Bright MLS IDX program and not all listings may be visible on the site.
The property information being provided on or through the website is for the personal, non-commercial use of consumers and such information may not be used for any purpose other than to identify prospective properties consumers may be interested in purchasing.
Some properties which appear for sale on the website may no longer be available because they are for instance, under contract, sold or are no longer being offered for sale.
Property information displayed is deemed reliable but is not guaranteed.
Copyright 2025 Bright MLS, Inc.