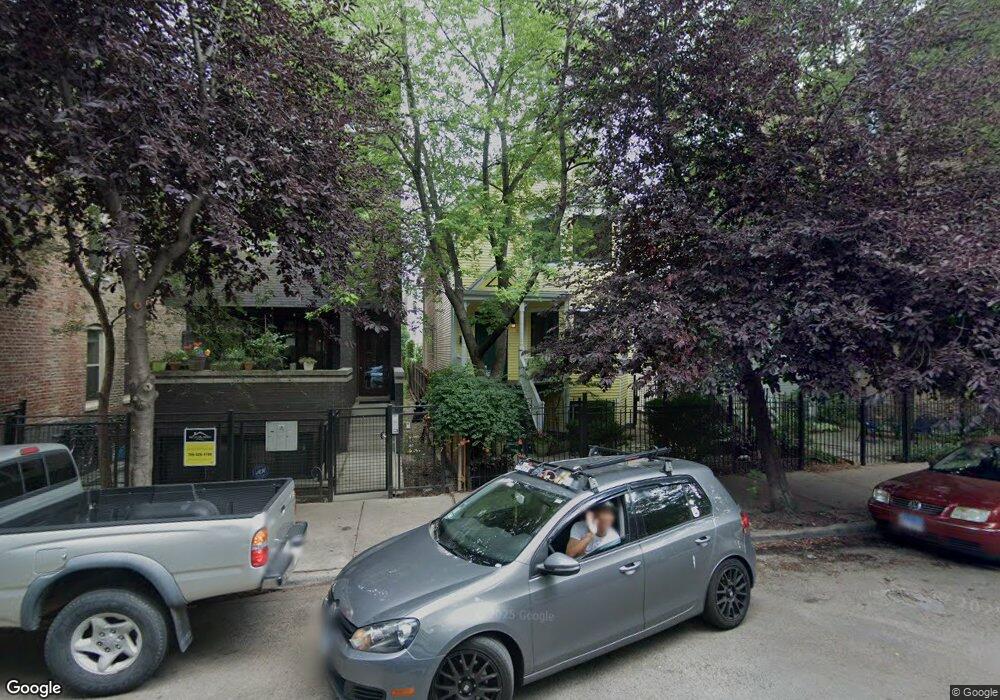
1055 N Marshfield Ave Chicago, IL 60622
East Village NeighborhoodEstimated Value: $820,000 - $1,261,000
4
Beds
4
Baths
2,014
Sq Ft
$546/Sq Ft
Est. Value
About This Home
This home is located at 1055 N Marshfield Ave, Chicago, IL 60622 and is currently estimated at $1,098,960, approximately $545 per square foot. 1055 N Marshfield Ave is a home located in Cook County with nearby schools including A.N. Pritzker School, Wells Community Academy High School, and Rowe Elementary School.
Ownership History
Date
Name
Owned For
Owner Type
Purchase Details
Closed on
Jul 30, 2011
Sold by
Barclay Jeffrey and Barclay Anne
Bought by
Larrea Barclay Jeffrey D and Larrea Barclay Anne
Current Estimated Value
Purchase Details
Closed on
Apr 30, 2003
Sold by
Wells Judith
Bought by
Barclay Jeffrey and Barclay Anne
Home Financials for this Owner
Home Financials are based on the most recent Mortgage that was taken out on this home.
Original Mortgage
$369,250
Outstanding Balance
$157,526
Interest Rate
6.02%
Mortgage Type
Unknown
Estimated Equity
$941,434
Purchase Details
Closed on
Apr 28, 1998
Sold by
Krosner Seth M and Johnson Phil
Bought by
Wells Judith A
Home Financials for this Owner
Home Financials are based on the most recent Mortgage that was taken out on this home.
Original Mortgage
$100,000
Interest Rate
7.18%
Create a Home Valuation Report for This Property
The Home Valuation Report is an in-depth analysis detailing your home's value as well as a comparison with similar homes in the area
Home Values in the Area
Average Home Value in this Area
Purchase History
| Date | Buyer | Sale Price | Title Company |
|---|---|---|---|
| Larrea Barclay Jeffrey D | -- | None Available | |
| Barclay Jeffrey | $527,500 | Rtc | |
| Barclay Jeffrey | $527,500 | Rtc | |
| Wells Judith A | $280,000 | Chicago Title Insurance Co |
Source: Public Records
Mortgage History
| Date | Status | Borrower | Loan Amount |
|---|---|---|---|
| Open | Barclay Jeffrey | $369,250 | |
| Closed | Barclay Jeffrey | $369,250 | |
| Previous Owner | Wells Judith A | $100,000 |
Source: Public Records
Tax History
| Year | Tax Paid | Tax Assessment Tax Assessment Total Assessment is a certain percentage of the fair market value that is determined by local assessors to be the total taxable value of land and additions on the property. | Land | Improvement |
|---|---|---|---|---|
| 2025 | $17,075 | $102,000 | $28,275 | $73,725 |
| 2024 | $17,075 | $102,000 | $28,275 | $73,725 |
| 2023 | $16,574 | $84,000 | $22,750 | $61,250 |
| 2022 | $16,574 | $84,000 | $22,750 | $61,250 |
| 2021 | $16,222 | $84,000 | $22,750 | $61,250 |
| 2020 | $17,668 | $82,412 | $11,050 | $71,362 |
| 2019 | $17,309 | $89,579 | $11,050 | $78,529 |
| 2018 | $17,016 | $89,579 | $11,050 | $78,529 |
| 2017 | $16,279 | $78,998 | $9,750 | $69,248 |
| 2016 | $15,322 | $78,998 | $9,750 | $69,248 |
| 2015 | $13,995 | $78,998 | $9,750 | $69,248 |
| 2014 | $10,767 | $60,601 | $8,125 | $52,476 |
| 2013 | $10,544 | $60,601 | $8,125 | $52,476 |
Source: Public Records
Map
Nearby Homes
- 1057 N Marshfield Ave Unit 3
- 1031 N Paulina St Unit 3F
- 1108 N Ashland Ave Unit 3
- 1076 N Marshfield Ave Unit 2
- 1035 N Hermitage Ave Unit 3
- 1518 W Cortez St Unit 3W
- 1523 W Thomas St Unit 1
- 629 N Ashland Ave
- 935 N Hermitage Ave Unit 3
- 1054 N Hermitage Ave Unit 2
- 917 N Hermitage Ave Unit 1
- 867 N Marshfield Ave Unit 2
- 1536 W Chestnut St Unit B
- 1101 N Wood St Unit 3
- 1442 W Cortez St Unit 2
- 1648 W Division St Unit 208
- 1648 W Division St Unit 703
- 1541 W Chestnut St Unit 2
- 1433 W Cortez St Unit PH
- 1002 N Wood St
- 1057 N Marshfield Ave Unit A
- 1057 N Marshfield Ave Unit B
- 1057 N Marshfield Ave Unit C
- 1057 N Marshfield Ave Unit 2
- 1053 N Marshfield Ave
- 1059 N Marshfield Ave
- 1059 N Marshfield Ave
- 1049 N Marshfield Ave
- 1049 N Marshfield Ave Unit 3R
- 1049 N Marshfield Ave Unit 2R
- 1049 N Marshfield Ave Unit 2CH
- 1049 N Marshfield Ave Unit 1
- 1049 N Marshfield Ave Unit 2COUCH
- 1049 N Marshfield Ave Unit 3F
- 1049 N Marshfield Ave Unit 2F
- 1061 N Marshfield Ave Unit 3
- 1061 N Marshfield Ave Unit 2
- 1061 N Marshfield Ave Unit 1
- 1065 N Marshfield Ave Unit 1
- 1065 N Marshfield Ave Unit 2
Your Personal Tour Guide
Ask me questions while you tour the home.