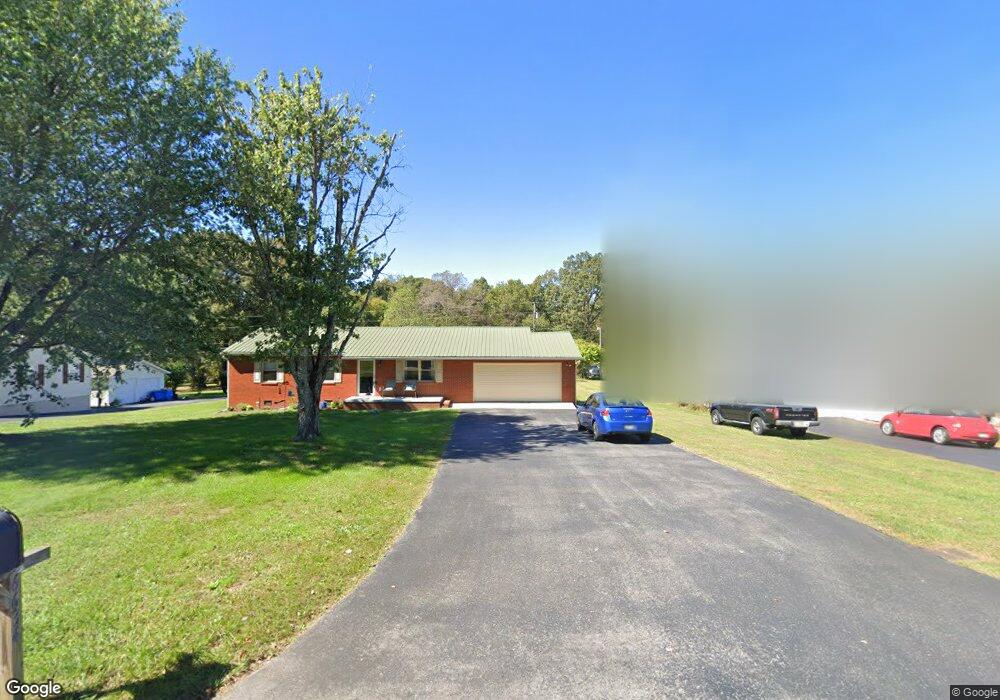
1055 Quail Ln Cookeville, TN 38506
Estimated Value: $344,000 - $439,000
3
Beds
2
Baths
2,068
Sq Ft
$190/Sq Ft
Est. Value
About This Home
This home is located at 1055 Quail Ln, Cookeville, TN 38506 and is currently estimated at $392,499, approximately $189 per square foot. 1055 Quail Ln is a home located in Putnam County with nearby schools including Cookeville High School, Algood Middle School, and Northeast Elementary School.
Ownership History
Date
Name
Owned For
Owner Type
Purchase Details
Closed on
Jul 27, 2004
Sold by
Kenneth Bender and Kenneth Natalia
Bought by
Bender Kenneth E & Natalia Tr
Current Estimated Value
Purchase Details
Closed on
Nov 8, 2001
Sold by
Alan Bender David
Bought by
Bender Kenneth E and Bender Nata
Purchase Details
Closed on
May 23, 2001
Bought by
Bender Kenneth Edward and Bender Natalia
Purchase Details
Closed on
Feb 7, 1990
Bought by
Chaffin Randall C and Sheila Ann
Purchase Details
Closed on
Apr 6, 1979
Bought by
Miller Grover and Miller Geneva
Create a Home Valuation Report for This Property
The Home Valuation Report is an in-depth analysis detailing your home's value as well as a comparison with similar homes in the area
Home Values in the Area
Average Home Value in this Area
Purchase History
| Date | Buyer | Sale Price | Title Company |
|---|---|---|---|
| Bender Kenneth E & Natalia Tr | -- | -- | |
| Bender Kenneth E | -- | -- | |
| Bender Kenneth Edward | $165,000 | -- | |
| Chaffin Randall C | $4,500 | -- | |
| Miller Grover | -- | -- |
Source: Public Records
Tax History Compared to Growth
Tax History
| Year | Tax Paid | Tax Assessment Tax Assessment Total Assessment is a certain percentage of the fair market value that is determined by local assessors to be the total taxable value of land and additions on the property. | Land | Improvement |
|---|---|---|---|---|
| 2024 | $1,596 | $60,000 | $6,850 | $53,150 |
| 2023 | $1,596 | $60,000 | $6,850 | $53,150 |
| 2022 | $1,483 | $60,000 | $6,850 | $53,150 |
| 2021 | $1,323 | $53,500 | $6,850 | $46,650 |
| 2020 | $1,182 | $53,500 | $6,850 | $46,650 |
| 2019 | $1,182 | $40,400 | $6,850 | $33,550 |
| 2018 | $1,103 | $40,400 | $6,850 | $33,550 |
| 2017 | $1,103 | $40,400 | $6,850 | $33,550 |
| 2016 | $1,103 | $40,400 | $6,850 | $33,550 |
| 2015 | $1,133 | $40,400 | $6,850 | $33,550 |
| 2014 | $1,035 | $36,897 | $0 | $0 |
Source: Public Records
Map
Nearby Homes