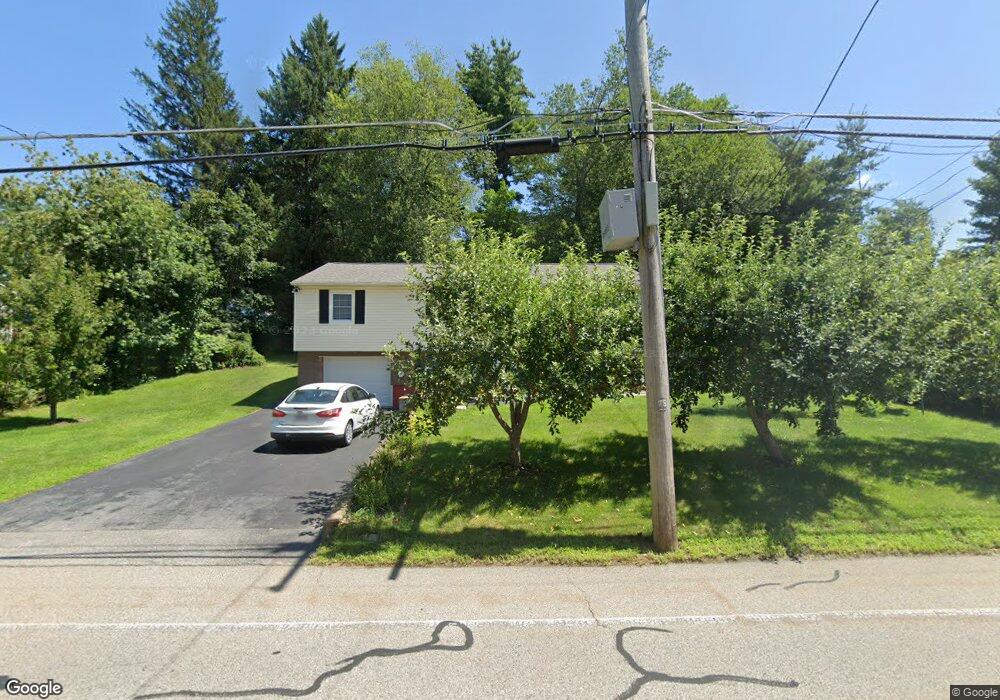
1055 School St Webster, MA 01570
Estimated Value: $407,038 - $464,000
3
Beds
2
Baths
1,744
Sq Ft
$252/Sq Ft
Est. Value
About This Home
This home is located at 1055 School St, Webster, MA 01570 and is currently estimated at $438,760, approximately $251 per square foot. 1055 School St is a home located in Worcester County with nearby schools including Park Avenue Elementary School, Webster Middle School, and Bartlett High School.
Ownership History
Date
Name
Owned For
Owner Type
Purchase Details
Closed on
Aug 17, 2007
Sold by
Legasey Linda D
Bought by
Gjergo Anila and Gjergo Nikolla
Current Estimated Value
Home Financials for this Owner
Home Financials are based on the most recent Mortgage that was taken out on this home.
Original Mortgage
$190,000
Interest Rate
6.67%
Mortgage Type
Purchase Money Mortgage
Purchase Details
Closed on
Oct 31, 2001
Sold by
Alberty Susana L
Bought by
Legasey Linda D
Home Financials for this Owner
Home Financials are based on the most recent Mortgage that was taken out on this home.
Original Mortgage
$130,000
Interest Rate
6.82%
Mortgage Type
Purchase Money Mortgage
Purchase Details
Closed on
Aug 31, 1990
Sold by
Halfrey Richard F
Bought by
Alberty Susana L
Purchase Details
Closed on
Jun 23, 1989
Sold by
Beardsley Louise H
Bought by
Halfrey Ricahrd F
Create a Home Valuation Report for This Property
The Home Valuation Report is an in-depth analysis detailing your home's value as well as a comparison with similar homes in the area
Home Values in the Area
Average Home Value in this Area
Purchase History
| Date | Buyer | Sale Price | Title Company |
|---|---|---|---|
| Gjergo Anila | $225,000 | -- | |
| Legasey Linda D | $189,900 | -- | |
| Alberty Susana L | $110,000 | -- | |
| Halfrey Ricahrd F | $114,000 | -- |
Source: Public Records
Mortgage History
| Date | Status | Borrower | Loan Amount |
|---|---|---|---|
| Open | Halfrey Ricahrd F | $175,000 | |
| Closed | Gjergo Anila | $190,000 | |
| Previous Owner | Halfrey Ricahrd F | $130,000 | |
| Previous Owner | Halfrey Ricahrd F | $16,000 |
Source: Public Records
Tax History
| Year | Tax Paid | Tax Assessment Tax Assessment Total Assessment is a certain percentage of the fair market value that is determined by local assessors to be the total taxable value of land and additions on the property. | Land | Improvement |
|---|---|---|---|---|
| 2025 | $3,774 | $317,700 | $62,000 | $255,700 |
| 2024 | $3,766 | $309,200 | $59,600 | $249,600 |
| 2023 | $3,488 | $279,000 | $56,800 | $222,200 |
| 2022 | $3,334 | $238,800 | $55,100 | $183,700 |
| 2021 | $3,313 | $219,400 | $52,700 | $166,700 |
| 2020 | $2,465 | $211,600 | $52,700 | $158,900 |
| 2019 | $2,943 | $192,000 | $52,700 | $139,300 |
| 2018 | $2,790 | $181,300 | $50,300 | $131,000 |
| 2017 | $2,560 | $169,200 | $49,300 | $119,900 |
| 2016 | $2,441 | $161,200 | $46,900 | $114,300 |
| 2015 | $2,240 | $152,600 | $46,000 | $106,600 |
Source: Public Records
Map
Nearby Homes
- 51 &52 lot Oscar Rd
- 27 Ash St
- 0 Carpenter Rd
- 00 Juniper Ln
- 418 High Street Extension
- 30 Valley St
- 17 Mount Pleasant St
- 36 Lake Pkwy
- 0 Wilsonville Rd Unit 24140220
- 40 High St
- 7 3rd Ave
- 2 Warsaw Ave Unit 3
- 0 Thompson Rd
- 38 Park St
- 2 Brookline St
- 19 Myrtle Ave
- 13 5th Ave
- 3 6th Ave
- 48 Lake St
- 95 Lake St
Your Personal Tour Guide
Ask me questions while you tour the home.