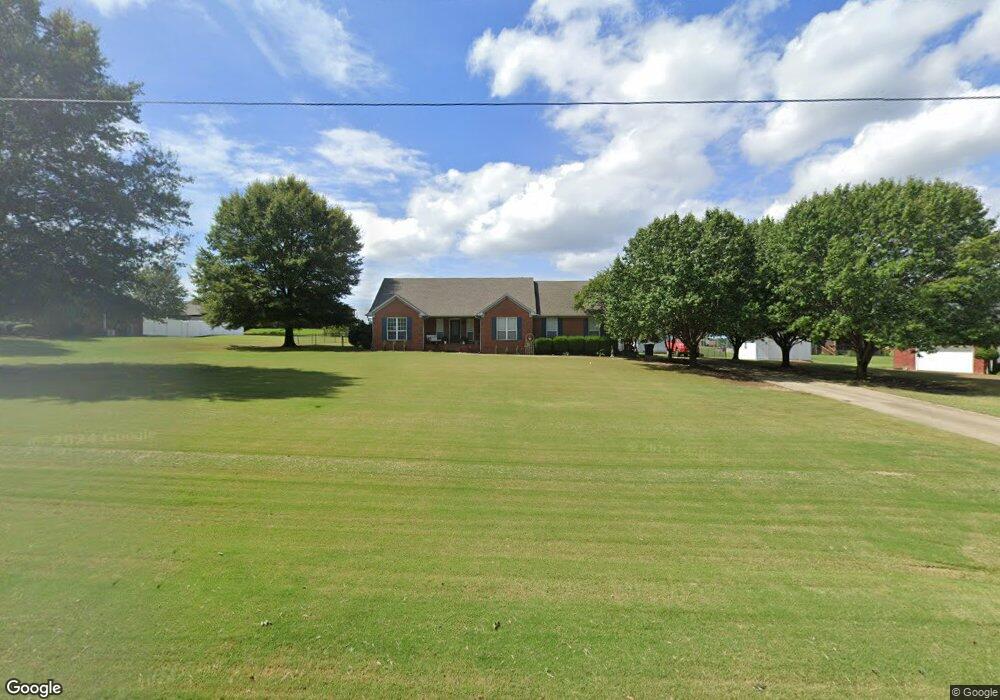
1055 Sharpsferry Rd Newbern, TN 38059
Estimated Value: $238,109 - $360,000
4
Beds
2
Baths
2,152
Sq Ft
$140/Sq Ft
Est. Value
About This Home
This home is located at 1055 Sharpsferry Rd, Newbern, TN 38059 and is currently estimated at $300,777, approximately $139 per square foot. 1055 Sharpsferry Rd is a home located in Dyer County with nearby schools including Newbern Elementary School, Northview Middle School, and Dyer County High School.
Ownership History
Date
Name
Owned For
Owner Type
Purchase Details
Closed on
Apr 5, 2010
Sold by
Murray Steven J
Bought by
Gurden Jeremiah V
Current Estimated Value
Home Financials for this Owner
Home Financials are based on the most recent Mortgage that was taken out on this home.
Original Mortgage
$184,907
Outstanding Balance
$122,971
Interest Rate
4.97%
Estimated Equity
$177,806
Purchase Details
Closed on
Aug 10, 2005
Sold by
Williams Phillip A
Bought by
Murray Steven and Murray Renee
Purchase Details
Closed on
Sep 28, 2001
Sold by
Miller James D and Miller Marcia D
Bought by
Williams Phillip A and Williams Traci
Purchase Details
Closed on
Dec 13, 1999
Sold by
Parks John H
Bought by
Miller James and Miller Marcia
Purchase Details
Closed on
Apr 16, 1998
Bought by
Parks John H and Parks Bill Parks
Create a Home Valuation Report for This Property
The Home Valuation Report is an in-depth analysis detailing your home's value as well as a comparison with similar homes in the area
Home Values in the Area
Average Home Value in this Area
Purchase History
| Date | Buyer | Sale Price | Title Company |
|---|---|---|---|
| Gurden Jeremiah V | $179,000 | -- | |
| Murray Steven | $154,000 | -- | |
| Williams Phillip A | $134,000 | -- | |
| Miller James | $127,000 | -- | |
| Parks John H | $168,700 | -- |
Source: Public Records
Mortgage History
| Date | Status | Borrower | Loan Amount |
|---|---|---|---|
| Open | Parks John H | $184,907 |
Source: Public Records
Tax History Compared to Growth
Tax History
| Year | Tax Paid | Tax Assessment Tax Assessment Total Assessment is a certain percentage of the fair market value that is determined by local assessors to be the total taxable value of land and additions on the property. | Land | Improvement |
|---|---|---|---|---|
| 2024 | $985 | $40,050 | $2,975 | $37,075 |
| 2023 | $1,511 | $40,050 | $2,975 | $37,075 |
| 2022 | $1,475 | $40,050 | $2,975 | $37,075 |
| 2021 | $1,475 | $40,050 | $2,975 | $37,075 |
| 2020 | $949 | $40,050 | $2,975 | $37,075 |
| 2019 | $1,495 | $36,150 | $2,975 | $33,175 |
| 2018 | $1,495 | $36,150 | $2,975 | $33,175 |
| 2017 | $1,495 | $36,150 | $2,975 | $33,175 |
| 2016 | $1,502 | $36,150 | $2,975 | $33,175 |
| 2015 | $1,450 | $36,150 | $2,975 | $33,175 |
| 2014 | $1,450 | $36,150 | $2,975 | $33,175 |
Source: Public Records
Map
Nearby Homes
- 1585 Sharps Ferry Rd
- 783 Sharps Ferry Rd
- 908 Granite Dr
- 45 Miller St
- 0 Biffle Rd
- 610 N Grayson St
- 310 N Grayson St
- 309 N Grayson St
- 502 E Johnson St
- 404 E Johnson St
- 0 N Quincy St
- 408 E Main St
- 521 E Main St
- 603 E Main St
- 404 W Main St
- 621 E Main St
- 526 W Main St
- 322 Flora Cir
- 838 Scenic Hills Dr
- 0 Roellen Newbern Rd
- 1005 Sharpsferry Rd
- 1075 Sharpsferry Rd
- 108 Crowne Hill Dr
- 114 Crowne Hill Dr
- 995 Sharpsferry Rd
- 112 Crowne Hill Dr
- 1080 Sharpsferry Rd
- Lot 9 Crowne Hill Dr
- Lot 56 Crowne Hill Dr
- Lot 58 Crowne Hill Dr
- 116 Crowne Hill Dr
- 111 Crowne Hill Dr
- 1020 Sharpsferry Rd
- 0000 Sharps Ferry Rd
- 00 Sharps Ferry Rd
- 975 Sharpsferry Rd
- 1000 Sharpsferry Rd
- 2101 Crowne Ridge Dr
- 2104 Crowne Heights Dr
- 2102 Crowne Ridge Dr