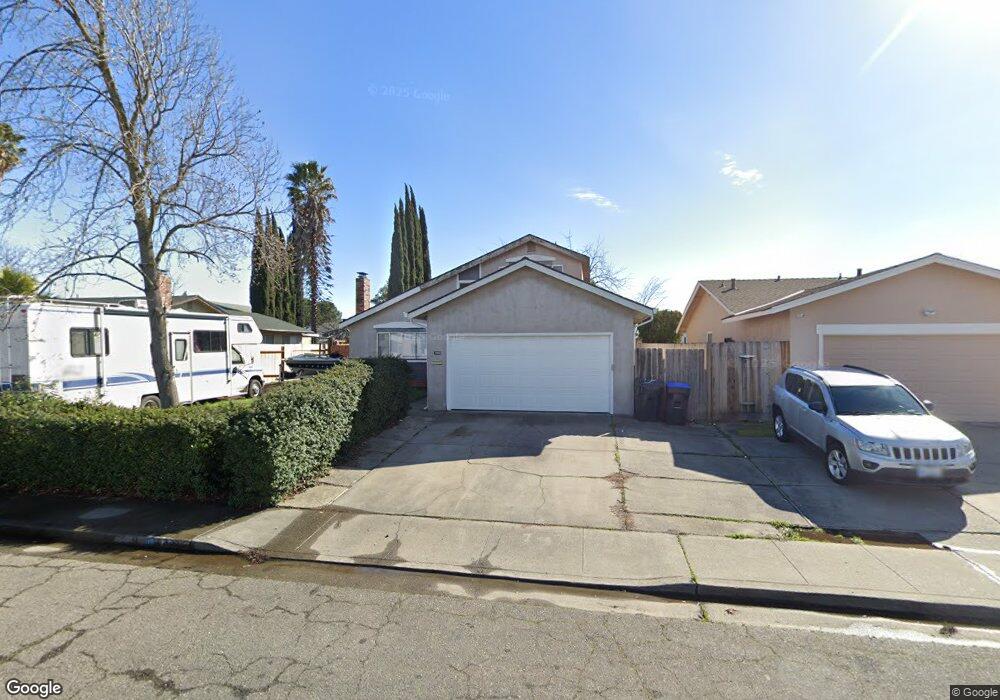
1055 Sparrow Ln Fairfield, CA 94533
Estimated Value: $469,500 - $511,000
4
Beds
2
Baths
1,584
Sq Ft
$315/Sq Ft
Est. Value
About This Home
This home is located at 1055 Sparrow Ln, Fairfield, CA 94533 and is currently estimated at $498,375, approximately $314 per square foot. 1055 Sparrow Ln is a home located in Solano County with nearby schools including Cleo Gordon Elementary School, Grange Middle School, and Fairfield High School.
Ownership History
Date
Name
Owned For
Owner Type
Purchase Details
Closed on
May 22, 2009
Sold by
Wurz Melissa Glynn
Bought by
Wurz Michael C Glynn
Current Estimated Value
Home Financials for this Owner
Home Financials are based on the most recent Mortgage that was taken out on this home.
Original Mortgage
$103,098
Outstanding Balance
$64,964
Interest Rate
4.8%
Mortgage Type
FHA
Estimated Equity
$433,411
Purchase Details
Closed on
May 20, 2009
Sold by
Freedy Sheryl Ann and Brabec Catherine Yvonne
Bought by
Glynn Wurz Michael C
Home Financials for this Owner
Home Financials are based on the most recent Mortgage that was taken out on this home.
Original Mortgage
$103,098
Outstanding Balance
$64,964
Interest Rate
4.8%
Mortgage Type
FHA
Estimated Equity
$433,411
Purchase Details
Closed on
Jun 27, 2006
Sold by
Crawford Marianne E
Bought by
The Marianne E Crawford Living Trust and Crawford Marianne E
Create a Home Valuation Report for This Property
The Home Valuation Report is an in-depth analysis detailing your home's value as well as a comparison with similar homes in the area
Home Values in the Area
Average Home Value in this Area
Purchase History
| Date | Buyer | Sale Price | Title Company |
|---|---|---|---|
| Wurz Michael C Glynn | -- | Placer Title Company | |
| Glynn Wurz Michael C | $105,000 | Placer Title Company | |
| The Marianne E Crawford Living Trust | -- | None Available |
Source: Public Records
Mortgage History
| Date | Status | Borrower | Loan Amount |
|---|---|---|---|
| Open | Glynn Wurz Michael C | $103,098 |
Source: Public Records
Tax History
| Year | Tax Paid | Tax Assessment Tax Assessment Total Assessment is a certain percentage of the fair market value that is determined by local assessors to be the total taxable value of land and additions on the property. | Land | Improvement |
|---|---|---|---|---|
| 2025 | $1,454 | $135,204 | $51,503 | $83,701 |
| 2024 | $1,454 | $132,554 | $50,494 | $82,060 |
| 2023 | $1,409 | $129,955 | $49,504 | $80,451 |
| 2022 | $1,390 | $127,408 | $48,534 | $78,874 |
| 2021 | $1,375 | $124,911 | $47,583 | $77,328 |
| 2020 | $1,343 | $123,632 | $47,096 | $76,536 |
| 2019 | $1,309 | $121,209 | $46,173 | $75,036 |
| 2018 | $1,349 | $118,833 | $45,268 | $73,565 |
| 2017 | $1,286 | $116,504 | $44,381 | $72,123 |
| 2016 | $1,267 | $114,220 | $43,511 | $70,709 |
| 2015 | $1,182 | $112,505 | $42,858 | $69,647 |
| 2014 | $1,170 | $110,302 | $42,019 | $68,283 |
Source: Public Records
Map
Nearby Homes
- 2013 Cormorant Dr
- 1213 Sprig Ct
- 849 Finch Way
- 1312 Sutter Ct
- 2386 Baltic Ct
- 1930 Grande Cir Unit 72
- 217 Del Luz Ct
- 1850 Blossom Ave Unit 115
- 1941 Grande Cir Unit 45
- 1941 Grande Cir Unit 48
- 1941 Grande Cir Unit 71
- 175 Del Sur Ct
- 2429 Baltic Dr
- 2321 Channing Place
- 237 Del Loma Ct
- 1695 Blossom Ave
- 50 El Basset Ct Unit 1
- 2275 Dover Ave
- 2532 Beaufort Ct
- 2076 Harte Ct
- 1049 Sparrow Ln
- 1054 Meadowlark Dr
- 1067 Sparrow Ln
- 1043 Sparrow Ln
- 1048 Meadowlark Dr
- 1060 Meadowlark Dr
- 1054 Sparrow Ln
- 1060 Sparrow Ln
- 1048 Sparrow Ln
- 1066 Meadowlark Dr
- 1042 Meadowlark Dr
- 1073 Sparrow Ln
- 1037 Sparrow Ln
- 1066 Sparrow Ln
- 1042 Sparrow Ln
- 1072 Meadowlark Dr
- 1036 Meadowlark Dr
- 1036 Sparrow Ln
Your Personal Tour Guide
Ask me questions while you tour the home.