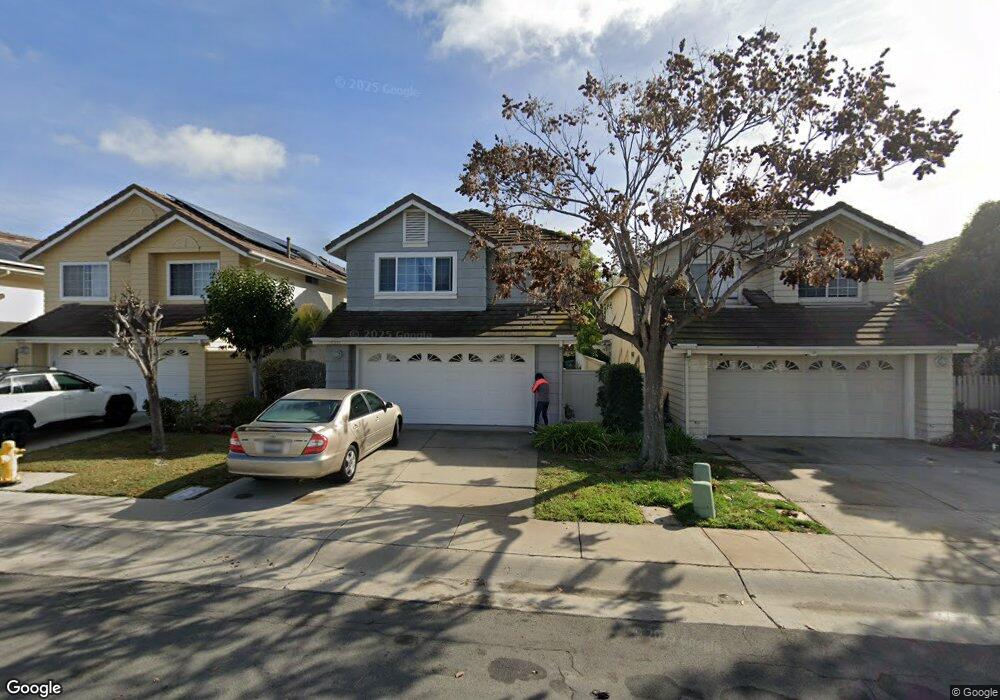
10551 Kemerton Rd San Diego, CA 92126
Mira Mesa NeighborhoodEstimated Value: $1,046,206 - $1,231,000
3
Beds
3
Baths
1,448
Sq Ft
$801/Sq Ft
Est. Value
About This Home
This home is located at 10551 Kemerton Rd, San Diego, CA 92126 and is currently estimated at $1,159,552, approximately $800 per square foot. 10551 Kemerton Rd is a home located in San Diego County with nearby schools including Hickman Elementary School, Challenger Middle School, and Mira Mesa High School.
Ownership History
Date
Name
Owned For
Owner Type
Purchase Details
Closed on
Oct 21, 2001
Sold by
Tran Quang T and Xu Li Ming
Bought by
Tran Quang T and Xu Li Ming
Current Estimated Value
Purchase Details
Closed on
Jul 26, 2000
Sold by
Tang Charles M
Bought by
Tran Quang T and Xu Li Ming
Home Financials for this Owner
Home Financials are based on the most recent Mortgage that was taken out on this home.
Original Mortgage
$120,000
Outstanding Balance
$43,449
Interest Rate
8.2%
Estimated Equity
$1,116,103
Purchase Details
Closed on
May 20, 1998
Sold by
Tang Charles M
Bought by
Tang Charles Moon
Home Financials for this Owner
Home Financials are based on the most recent Mortgage that was taken out on this home.
Original Mortgage
$152,000
Interest Rate
7.13%
Purchase Details
Closed on
Aug 1, 1997
Sold by
Tang Lisa S H
Bought by
Tang Charles Moon
Purchase Details
Closed on
Jun 30, 1989
Create a Home Valuation Report for This Property
The Home Valuation Report is an in-depth analysis detailing your home's value as well as a comparison with similar homes in the area
Home Values in the Area
Average Home Value in this Area
Purchase History
| Date | Buyer | Sale Price | Title Company |
|---|---|---|---|
| Tran Quang T | -- | -- | |
| Tran Quang T | $263,000 | Fidelity National Title Co | |
| Tang Charles Moon | -- | Chicago Title Co | |
| Tang Charles Moon | -- | -- | |
| -- | $181,000 | -- |
Source: Public Records
Mortgage History
| Date | Status | Borrower | Loan Amount |
|---|---|---|---|
| Open | Tran Quang T | $120,000 | |
| Previous Owner | Tang Charles Moon | $152,000 |
Source: Public Records
Tax History Compared to Growth
Tax History
| Year | Tax Paid | Tax Assessment Tax Assessment Total Assessment is a certain percentage of the fair market value that is determined by local assessors to be the total taxable value of land and additions on the property. | Land | Improvement |
|---|---|---|---|---|
| 2025 | $4,808 | $402,053 | $185,876 | $216,177 |
| 2024 | $4,808 | $394,171 | $182,232 | $211,939 |
| 2023 | $4,699 | $386,443 | $178,659 | $207,784 |
| 2022 | $4,572 | $378,866 | $175,156 | $203,710 |
| 2021 | $4,538 | $371,438 | $171,722 | $199,716 |
| 2020 | $4,483 | $367,631 | $169,962 | $197,669 |
| 2019 | $4,401 | $360,424 | $166,630 | $193,794 |
| 2018 | $4,115 | $353,358 | $163,363 | $189,995 |
| 2017 | $4,012 | $346,430 | $160,160 | $186,270 |
| 2016 | $3,946 | $339,638 | $157,020 | $182,618 |
| 2015 | $3,887 | $334,537 | $154,662 | $179,875 |
| 2014 | $3,825 | $327,985 | $151,633 | $176,352 |
Source: Public Records
Map
Nearby Homes
- 10628 Kemerton Rd
- 10740 Aderman Ave Unit 66
- 10646 Aderman Ave Unit 21
- 10785 Chinon Cir
- 10606 Aderman Ave Unit 5
- 7506 Flanders Dr
- 7427 Kamwood St
- 10774 Dabney Dr Unit 20
- 10791 Wallingford Rd
- 10821 Wallingford Rd
- 10692 Dabney Dr Unit 102
- 10668 Dabney Dr Unit 122
- 10668 Dabney Dr Unit 125
- 7387 New Salem St
- 11050 Solstice Way
- Plan 3 at Meadows District at 3Roots - Atwood at 3Roots
- Plan 4 at Meadows District at 3Roots - Atwood at 3Roots
- Plan 2 at Meadows District at 3Roots - Atwood at 3Roots
- Plan 5 at Meadows District at 3Roots - Atwood at 3Roots
- Plan 1 at Meadows District at 3Roots - Atwood at 3Roots
- 10555 Kemerton Rd
- 10545 Kemerton Rd
- 10561 Kemerton Rd
- 10541 Kemeron Rd
- 10541 Kemerton Rd
- 10565 Kemerton Rd Unit 3
- 10571 Kemerton Rd
- 10575 Kemerton Rd
- 10550 Kemerton Rd
- 10556 Kemerton Rd
- 10546 Kemerton Rd
- 10535 Kemerton Rd
- 7154 Schilling Ave Unit 40
- 7154 Schilling Ave Unit 39
- 7154 Schilling Ave Unit 38
- 7154 Schilling Ave Unit 37
- 7154 Schilling Ave Unit 36
- 7154 Schilling Ave Unit 35
- 7154 Schilling Ave Unit 34
- 7154 Schilling Ave Unit 33