10551 Kerrigan Ct Santee, CA 92071
Estimated Value: $590,186 - $695,000
3
Beds
2
Baths
1,323
Sq Ft
$476/Sq Ft
Est. Value
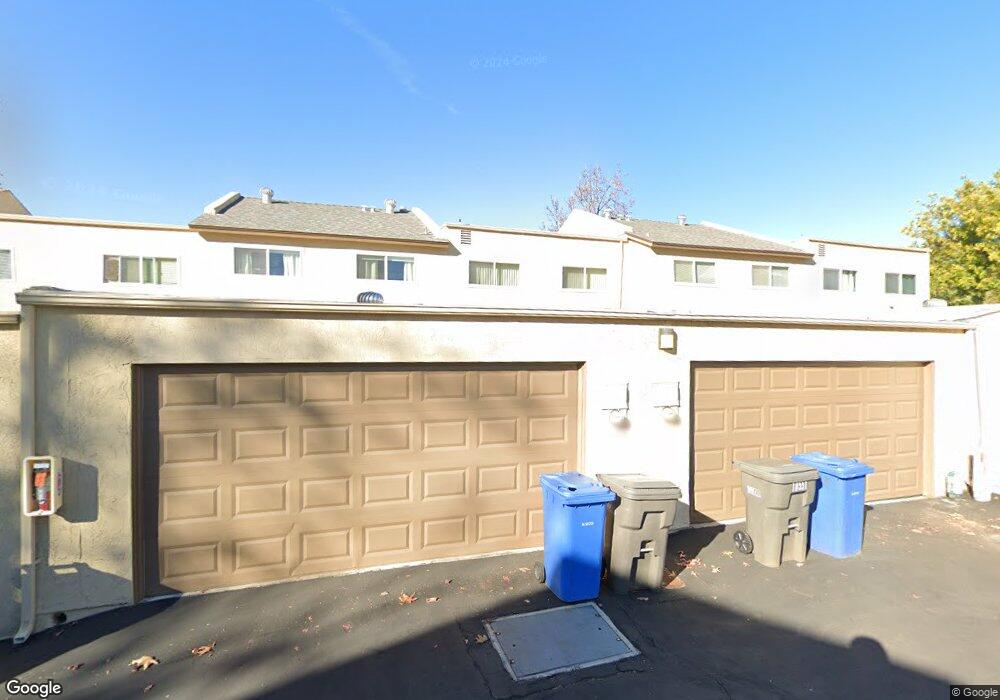
About This Home
This home is located at 10551 Kerrigan Ct, Santee, CA 92071 and is currently estimated at $630,047, approximately $476 per square foot. 10551 Kerrigan Ct is a home located in San Diego County with nearby schools including Cajon Park Elementary School and Santana High School.
Ownership History
Date
Name
Owned For
Owner Type
Purchase Details
Closed on
Oct 9, 2015
Sold by
Jennings Bret J and Jennings Donna K
Bought by
Bret & Donna Jennings Trust and Jennings Donna Kay
Current Estimated Value
Purchase Details
Closed on
Nov 7, 2006
Sold by
Jennings Bret J
Bought by
Jennings Bret J and Jennings Donna K
Home Financials for this Owner
Home Financials are based on the most recent Mortgage that was taken out on this home.
Original Mortgage
$239,400
Outstanding Balance
$142,322
Interest Rate
6.3%
Mortgage Type
New Conventional
Estimated Equity
$487,725
Purchase Details
Closed on
Aug 23, 2003
Sold by
Jackel Donald and Jackel Sandra
Bought by
Jackel Donald and Jackel Sandra
Purchase Details
Closed on
Jun 18, 2003
Sold by
Jackel Donald and Jackel Sandra
Bought by
Jackel Donald and Jackel Sandra
Purchase Details
Closed on
Nov 23, 1988
Create a Home Valuation Report for This Property
The Home Valuation Report is an in-depth analysis detailing your home's value as well as a comparison with similar homes in the area
Home Values in the Area
Average Home Value in this Area
Purchase History
| Date | Buyer | Sale Price | Title Company |
|---|---|---|---|
| Bret & Donna Jennings Trust | -- | None Available | |
| Jennings Bret J | -- | Commonwealth Land Title | |
| Jennings Bret J | -- | Commonwealth Land Title Co | |
| Jackel Donald | -- | -- | |
| Jackel Donald | -- | -- | |
| -- | $92,000 | -- |
Source: Public Records
Mortgage History
| Date | Status | Borrower | Loan Amount |
|---|---|---|---|
| Open | Jennings Bret J | $239,400 |
Source: Public Records
Tax History Compared to Growth
Tax History
| Year | Tax Paid | Tax Assessment Tax Assessment Total Assessment is a certain percentage of the fair market value that is determined by local assessors to be the total taxable value of land and additions on the property. | Land | Improvement |
|---|---|---|---|---|
| 2025 | $2,076 | $172,600 | $31,359 | $141,241 |
| 2024 | $2,076 | $169,217 | $30,745 | $138,472 |
| 2023 | $2,011 | $165,900 | $30,143 | $135,757 |
| 2022 | $1,992 | $162,648 | $29,552 | $133,096 |
| 2021 | $1,962 | $159,460 | $28,973 | $130,487 |
| 2020 | $1,937 | $157,826 | $28,676 | $129,150 |
| 2019 | $1,870 | $154,732 | $28,114 | $126,618 |
| 2018 | $1,831 | $151,699 | $27,563 | $124,136 |
| 2017 | $1,806 | $148,725 | $27,023 | $121,702 |
| 2016 | $1,751 | $145,810 | $26,494 | $119,316 |
| 2015 | $1,727 | $143,621 | $26,097 | $117,524 |
| 2014 | $1,692 | $140,808 | $25,586 | $115,222 |
Source: Public Records
Map
Nearby Homes
- 10525 Flora Verda Ct
- 10313 Princess Marcie Dr
- 10232 Princess Sarit Way
- 10784 N Magnolia Ave Unit H2
- 10784 N Magnolia Ave Unit H8
- 10306 Princess Joann Rd
- 10118 Cedar Springs Dr
- 10005 White Pine Ln
- 10209 Maple Tree Rd
- 10252 Casa Ct
- 10520 El Nopal
- 11009 Summit Ave Unit n/a
- 11009 Summit Ave
- 10165 W Glendon Cir
- 11025 Summit Ave
- 11025 Summit Ave Unit n/a
- 10138 Waynecrest Ln
- 0 Santana St
- 10143 Allenwood Way
- 10646 Montura Ct
- 10549 Kerrigan Ct
- 10553 Kerrigan Ct
- 10555 Kerrigan Ct
- 10547 Kerrigan Ct
- 10545 Kerrigan Ct
- 10560 Kerrigan Ct
- 10543 Kerrigan Ct
- 10586 Kerrigan Ct
- 10558 Kerrigan Ct
- 10557 Kerrigan Ct
- 10541 Kerrigan Ct
- 10588 Kerrigan Ct
- 10556 Kerrigan Ct
- 10539 Kerrigan Ct
- 10554 Kerrigan Ct
- 10590 Kerrigan Ct
- 10559 Kerrigan Ct
- 10592 Kerrigan Ct
- 10552 Kerrigan Ct
- 10563 Kerrigan Ct