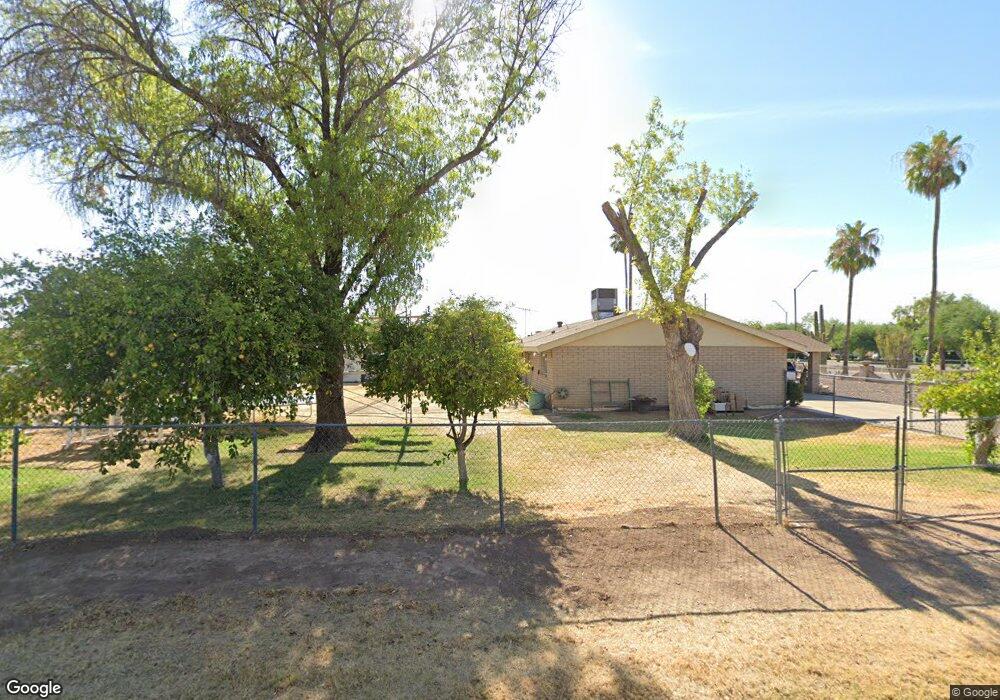
10554 W Thomas Rd Avondale, AZ 85392
Garden Lakes NeighborhoodEstimated Value: $464,797 - $659,000
--
Bed
2
Baths
2,128
Sq Ft
$259/Sq Ft
Est. Value
About This Home
This home is located at 10554 W Thomas Rd, Avondale, AZ 85392 and is currently estimated at $550,449, approximately $258 per square foot. 10554 W Thomas Rd is a home located in Maricopa County with nearby schools including Garden Lakes Elementary School and Westview High School.
Ownership History
Date
Name
Owned For
Owner Type
Purchase Details
Closed on
Aug 27, 2018
Sold by
Fernandez Avelardo and Fernandez Juana P
Bought by
Fernandez Avelardo C and Fernandez Juana P
Current Estimated Value
Purchase Details
Closed on
Dec 23, 1999
Sold by
Mickelson Joe E and Romero John F
Bought by
Fernandez Avelardo and Fernandez Juana P
Home Financials for this Owner
Home Financials are based on the most recent Mortgage that was taken out on this home.
Original Mortgage
$144,000
Outstanding Balance
$40,464
Interest Rate
6.5%
Mortgage Type
New Conventional
Estimated Equity
$509,985
Purchase Details
Closed on
Jun 23, 1998
Sold by
Mickelson Joe E
Bought by
Mickelson Joe E and Romero John F
Purchase Details
Closed on
Sep 11, 1996
Sold by
Chesler Mark S and Chesler Deeann M
Bought by
Mickelson Joe E
Home Financials for this Owner
Home Financials are based on the most recent Mortgage that was taken out on this home.
Original Mortgage
$103,200
Interest Rate
8.1%
Mortgage Type
New Conventional
Create a Home Valuation Report for This Property
The Home Valuation Report is an in-depth analysis detailing your home's value as well as a comparison with similar homes in the area
Home Values in the Area
Average Home Value in this Area
Purchase History
| Date | Buyer | Sale Price | Title Company |
|---|---|---|---|
| Fernandez Avelardo C | -- | None Available | |
| Fernandez Avelardo | $178,000 | Stewart Title & Trust Phoeni | |
| Mickelson Joe E | -- | Chicago Title Insurance Co | |
| Mickelson Joe E | $129,000 | Chicago Title Insurance Co |
Source: Public Records
Mortgage History
| Date | Status | Borrower | Loan Amount |
|---|---|---|---|
| Open | Fernandez Avelardo | $144,000 | |
| Previous Owner | Mickelson Joe E | $103,200 |
Source: Public Records
Tax History Compared to Growth
Tax History
| Year | Tax Paid | Tax Assessment Tax Assessment Total Assessment is a certain percentage of the fair market value that is determined by local assessors to be the total taxable value of land and additions on the property. | Land | Improvement |
|---|---|---|---|---|
| 2025 | $2,367 | $19,088 | -- | -- |
| 2024 | $2,413 | $18,179 | -- | -- |
| 2023 | $2,413 | $34,400 | $6,880 | $27,520 |
| 2022 | $2,331 | $27,380 | $5,470 | $21,910 |
| 2021 | $2,220 | $25,030 | $5,000 | $20,030 |
| 2020 | $2,154 | $24,280 | $4,850 | $19,430 |
| 2019 | $2,175 | $22,300 | $4,460 | $17,840 |
| 2018 | $2,053 | $19,600 | $3,920 | $15,680 |
| 2017 | $1,890 | $17,120 | $3,420 | $13,700 |
| 2016 | $1,739 | $14,600 | $2,920 | $11,680 |
| 2015 | $1,740 | $13,950 | $2,790 | $11,160 |
Source: Public Records
Map
Nearby Homes
- 10542 W La Reata Ave
- 10602 W Roanoke Ave
- 10517 W Earll Dr
- 10414 W Windsor Ave
- 10733 W Clover Way
- 2602 N 106th Ave
- 10517 W Virginia Ave
- 10729 W Laurelwood Ln
- 10810 W Virginia Ave
- 10505 W Wilshire Dr
- 10951 W Ivory Ln Unit 3
- 2513 N 109th Ave
- 2528 N 109th Ave
- 2311 N 107th Ave
- 2505 N 109th Ave
- 3517 N 106th Dr
- 10562 W Alvarado Rd
- 2618 N 110th Dr
- 3534 N 106th Ln
- 3121 N Meadow Dr
- 10542 W Thomas Rd
- 10605 W Catalina Dr
- 10555 W Catalina Dr
- 10545 W Catalina Dr
- 2951 N 106th Dr
- 10613 W Catalina Dr
- 10532 W Thomas Rd Unit 157
- 10532 W Thomas Rd
- 2959 N 106th Dr
- 10610 W La Reata Ave
- 10614 W La Reata Ave
- 10621 W Catalina Dr
- 10618 W La Reata Ave
- 10606 W La Reata Ave
- 10529 W Catalina Dr
- 10622 W La Reata Ave
- 2967 N 106th Dr
- 10626 W La Reata Ave
- 10622 W Catalina Dr
- 10630 W La Reata Ave