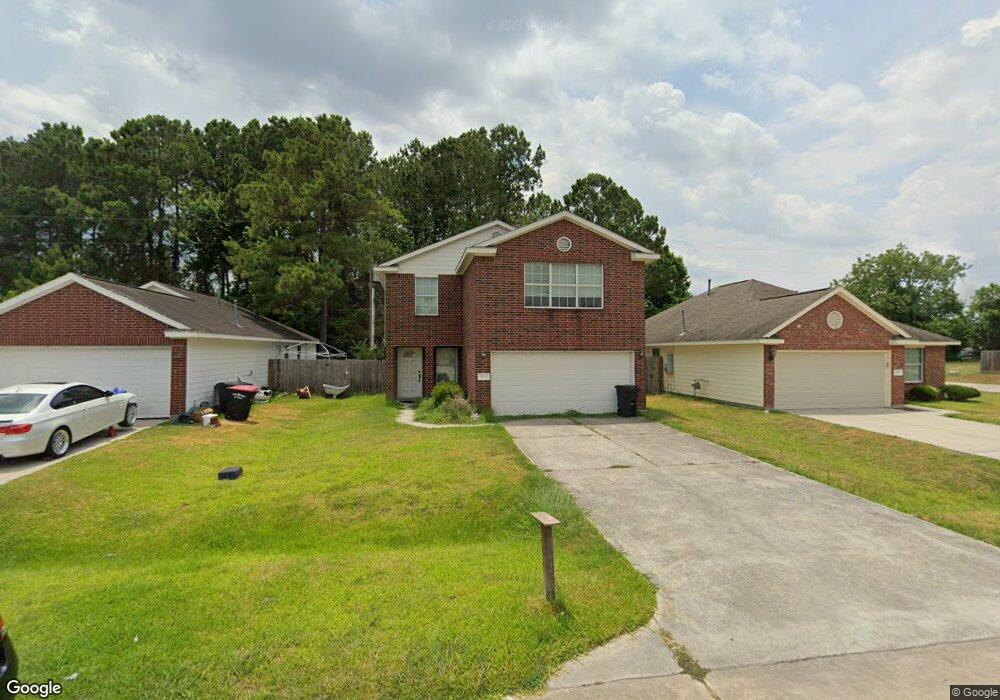
10555 Pine Landing Dr Houston, TX 77088
North Houston NeighborhoodEstimated Value: $231,000 - $247,000
3
Beds
3
Baths
1,550
Sq Ft
$154/Sq Ft
Est. Value
About This Home
This home is located at 10555 Pine Landing Dr, Houston, TX 77088 and is currently estimated at $239,148, approximately $154 per square foot. 10555 Pine Landing Dr is a home located in Harris County with nearby schools including Stovall School, Caraway Intermediate School, and Caraway Elementary School.
Ownership History
Date
Name
Owned For
Owner Type
Purchase Details
Closed on
Oct 29, 2015
Sold by
H & J Black Conroe Properites Llc
Bought by
Vidal Jody
Current Estimated Value
Home Financials for this Owner
Home Financials are based on the most recent Mortgage that was taken out on this home.
Original Mortgage
$17,012
Outstanding Balance
$13,449
Interest Rate
3.94%
Mortgage Type
FHA
Estimated Equity
$225,699
Purchase Details
Closed on
Mar 19, 2013
Sold by
Woodcreek Builders Inc
Bought by
Texas Community Bank Na
Purchase Details
Closed on
Dec 7, 2011
Sold by
Texas Community Bank Na
Bought by
Woodcreek Builders Inc
Home Financials for this Owner
Home Financials are based on the most recent Mortgage that was taken out on this home.
Original Mortgage
$102,959
Interest Rate
4.14%
Mortgage Type
Seller Take Back
Create a Home Valuation Report for This Property
The Home Valuation Report is an in-depth analysis detailing your home's value as well as a comparison with similar homes in the area
Home Values in the Area
Average Home Value in this Area
Purchase History
| Date | Buyer | Sale Price | Title Company |
|---|---|---|---|
| Vidal Jody | -- | First American Title | |
| Texas Community Bank Na | $102,959 | None Available | |
| Woodcreek Builders Inc | -- | Chicago Title |
Source: Public Records
Mortgage History
| Date | Status | Borrower | Loan Amount |
|---|---|---|---|
| Open | Vidal Jody | $17,012 | |
| Previous Owner | Woodcreek Builders Inc | $102,959 |
Source: Public Records
Tax History Compared to Growth
Tax History
| Year | Tax Paid | Tax Assessment Tax Assessment Total Assessment is a certain percentage of the fair market value that is determined by local assessors to be the total taxable value of land and additions on the property. | Land | Improvement |
|---|---|---|---|---|
| 2025 | $5,002 | $218,992 | $41,468 | $177,524 |
| 2024 | $5,002 | $207,454 | $41,468 | $165,986 |
| 2023 | $5,002 | $220,374 | $41,468 | $178,906 |
| 2022 | $5,722 | $191,368 | $29,006 | $162,362 |
| 2021 | $5,404 | $156,400 | $29,006 | $127,394 |
| 2020 | $5,515 | $155,055 | $29,006 | $126,049 |
| 2019 | $5,165 | $174,203 | $29,006 | $145,197 |
| 2018 | $1,474 | $156,021 | $29,006 | $127,015 |
| 2017 | $4,138 | $116,023 | $12,891 | $103,132 |
| 2016 | $4,138 | $116,023 | $12,891 | $103,132 |
| 2015 | $3,926 | $111,213 | $12,891 | $98,322 |
| 2014 | $3,926 | $111,213 | $12,891 | $98,322 |
Source: Public Records
Map
Nearby Homes
- 10555 Logger Pine Trail
- 10527 Logger Pine Trail
- 10506 Pine Landing Dr
- 10634 Logger Pine Trail
- 2234 Hampton St
- 2415 Fallen Pine Ln
- 10642 Logger Pine Trail Unit B
- 2418 Fallen Pine Ln
- 2422 Fallen Pine Ln
- 2325 Hampton St
- 2326 Wavell St
- 2330 Wavell St
- 2020 & 2022 Wavell St
- 2026 Wavell St
- 1918 Hampton St
- 2106 Dewalt St Unit A
- 9298 Plan at Shiloh Reserve
- 9297 Plan at Shiloh Reserve
- 9299 Plan at Shiloh Reserve
- 2110 Dewalt St Unit G
- 10551 Pine Landing Dr
- 10559 Pine Landing Dr
- 10547 Pine Landing Dr
- 10543 Pine Landing Dr
- 10603 Pine Landing Dr
- 10603 Pine Landing Dr Unit A
- 10554 Pine Landing Dr
- 10550 Pine Landing Dr
- 10558 Pine Landing Dr
- 10546 Pine Landing Dr
- 10539 Pine Landing Dr
- 176 Jackson St
- 175 Jackson St
- 10542 Pine Landing Dr
- 174 Jackson St
- 10607 Pine Landing Dr
- 10607 Pine Landing Dr Unit A
- 10602 Pine Landing Dr
- 10602 Pine Landing Dr Unit B
- 10602 Pine Landing Dr Unit A