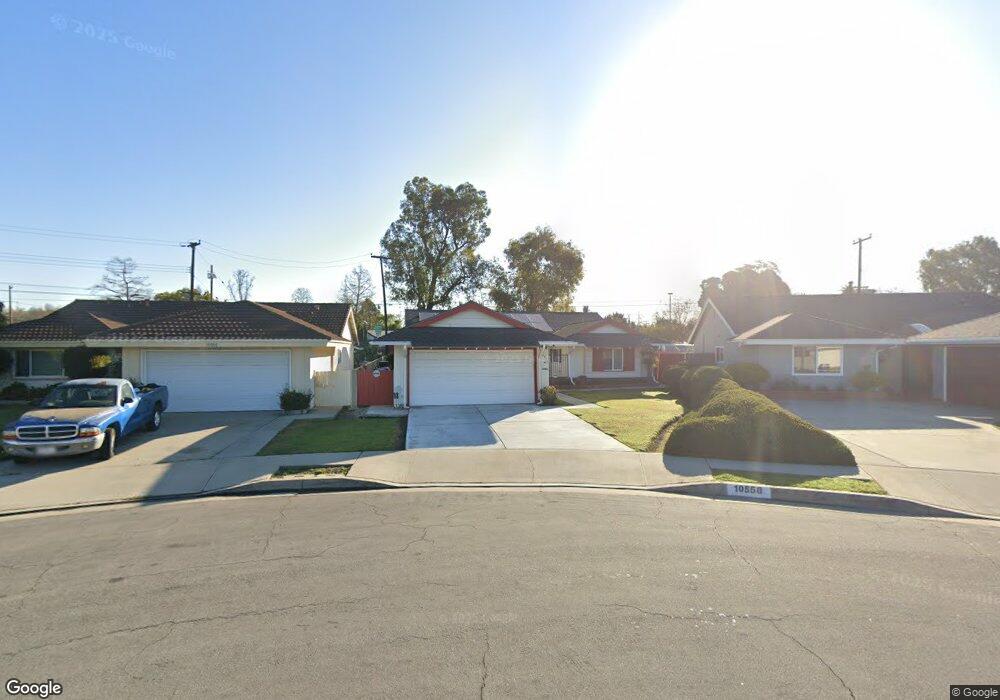
10558 Hester Ave Whittier, CA 90604
South Whittier NeighborhoodEstimated Value: $805,000 - $981,000
4
Beds
2
Baths
1,715
Sq Ft
$514/Sq Ft
Est. Value
About This Home
This home is located at 10558 Hester Ave, Whittier, CA 90604 and is currently estimated at $882,096, approximately $514 per square foot. 10558 Hester Ave is a home located in Los Angeles County with nearby schools including Orchard Dale Elementary School, Hillview Middle School, and La Serna High School.
Ownership History
Date
Name
Owned For
Owner Type
Purchase Details
Closed on
Dec 21, 2017
Sold by
Monarrez Gilbert J and Monarrez Irene M
Bought by
Monarrez Gilbert J and Monarrez Irene M
Current Estimated Value
Home Financials for this Owner
Home Financials are based on the most recent Mortgage that was taken out on this home.
Original Mortgage
$877,500
Interest Rate
4.92%
Mortgage Type
Reverse Mortgage Home Equity Conversion Mortgage
Purchase Details
Closed on
Jul 25, 2005
Sold by
Monarrez Gilbert J and Monarrez Irene M
Bought by
Monarrez Gilbert J and Monarrez Irene M
Home Financials for this Owner
Home Financials are based on the most recent Mortgage that was taken out on this home.
Original Mortgage
$469,342
Interest Rate
5.27%
Mortgage Type
FHA
Purchase Details
Closed on
Oct 24, 2000
Sold by
Monarrez Gilbert J and Monarrez Irene M
Bought by
Monarrez Gilbert J and Monarrez Irene M
Create a Home Valuation Report for This Property
The Home Valuation Report is an in-depth analysis detailing your home's value as well as a comparison with similar homes in the area
Home Values in the Area
Average Home Value in this Area
Purchase History
| Date | Buyer | Sale Price | Title Company |
|---|---|---|---|
| Monarrez Gilbert J | -- | First American Title Company | |
| Monarrez Gilbert J | -- | -- | |
| Monarrez Gilbert J | -- | -- | |
| Monarrez Gilbert J | -- | -- |
Source: Public Records
Mortgage History
| Date | Status | Borrower | Loan Amount |
|---|---|---|---|
| Closed | Monarrez Gilbert J | $877,500 | |
| Closed | Monarrez Gilbert J | $469,342 |
Source: Public Records
Tax History Compared to Growth
Tax History
| Year | Tax Paid | Tax Assessment Tax Assessment Total Assessment is a certain percentage of the fair market value that is determined by local assessors to be the total taxable value of land and additions on the property. | Land | Improvement |
|---|---|---|---|---|
| 2025 | $1,711 | $103,635 | $37,964 | $65,671 |
| 2024 | $1,711 | $101,604 | $37,220 | $64,384 |
| 2023 | $1,685 | $99,613 | $36,491 | $63,122 |
| 2022 | $1,649 | $97,661 | $35,776 | $61,885 |
| 2021 | $1,611 | $95,747 | $35,075 | $60,672 |
| 2019 | $1,578 | $92,909 | $34,036 | $58,873 |
| 2018 | $1,443 | $91,088 | $33,369 | $57,719 |
| 2016 | $1,350 | $87,553 | $32,074 | $55,479 |
| 2015 | $1,338 | $86,239 | $31,593 | $54,646 |
| 2014 | $1,328 | $84,551 | $30,975 | $53,576 |
Source: Public Records
Map
Nearby Homes
- 10517 La Serna Dr
- 15069 Mulberry Dr
- 15413 Ashley Ct
- 11237 Gladhill Rd Unit 3
- 11237 Gladhill Rd Unit 12
- 11237 Gladhill Rd Unit 5
- 11237 Gladhill Rd Unit 15
- 11124 Stamy Rd
- 15246 Mystic St
- 10010 Cole Rd
- 11245 Gladhill Rd Unit 10
- 16428 Whittier Blvd Unit 2
- 10847 La Mirada Blvd
- 10857 La Mirada Blvd
- 14865 Mulberry Dr Unit 1101
- 14816 Lanning Dr
- 14747 Glenn Dr
- 11548 Kibbee Ave
- 15041 Cerecita Dr
- 15914 Lashburn St
- 10562 Hester Ave
- 10554 Hester Ave
- 10568 Hester Ave
- 10550 Hester Ave
- 10574 Hester Ave
- 10546 Hester Ave
- 10555 Hester Ave
- 10569 Hester Ave
- 10580 Hester Ave
- 10540 Hester Ave
- 10543 Hester Ave
- 10575 Hester Ave
- 10602 Hester Ave
- 10534 Hester Ave
- 10539 Hester Ave
- 10581 Hester Ave
- 10532 Cole Rd
- 10603 Hester Ave
- 10608 Hester Ave
- 10533 Hester Ave