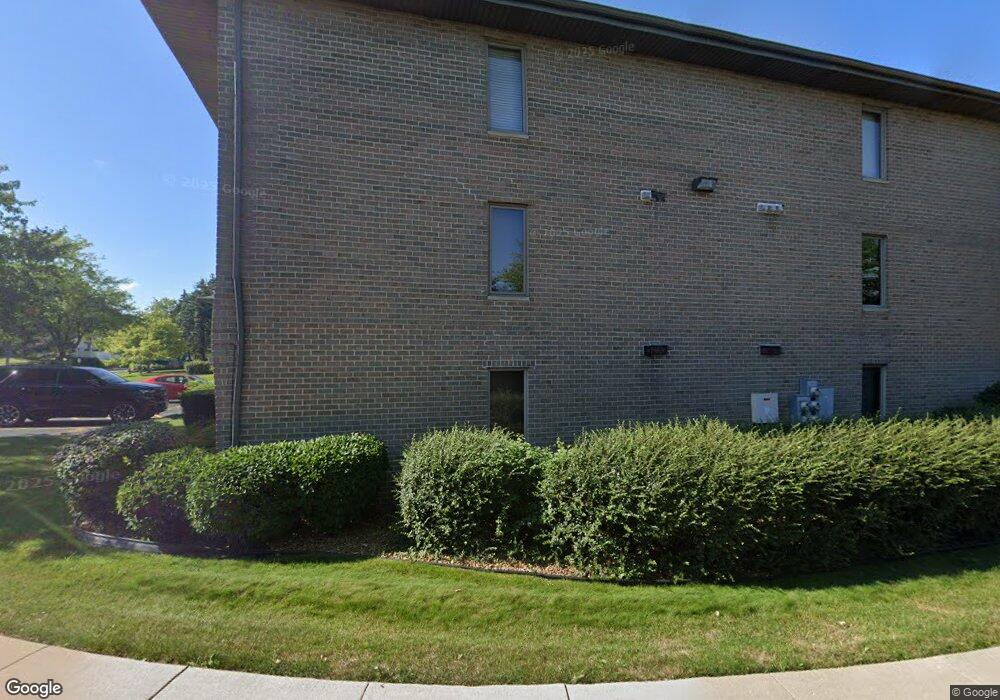
1056 Ashley Ct N Unit 21A Lockport, IL 60441
Estimated Value: $222,935 - $232,000
--
Bed
--
Bath
--
Sq Ft
0.47
Acres
About This Home
This home is located at 1056 Ashley Ct N Unit 21A, Lockport, IL 60441 and is currently estimated at $226,484. 1056 Ashley Ct N Unit 21A is a home located in Will County with nearby schools including Milne Grove Elementary School, Kelvin Grove Jr High School, and Lockport Township High School East.
Ownership History
Date
Name
Owned For
Owner Type
Purchase Details
Closed on
Sep 22, 2025
Sold by
Bernard A Ward Revocable Living Trust and Ward Bernard D
Bought by
Capiak Maura S
Current Estimated Value
Home Financials for this Owner
Home Financials are based on the most recent Mortgage that was taken out on this home.
Original Mortgage
$107,000
Outstanding Balance
$107,000
Interest Rate
6.63%
Mortgage Type
New Conventional
Estimated Equity
$119,484
Purchase Details
Closed on
Jul 17, 2020
Sold by
Ward Bernard A
Bought by
Bernard A Ward Revocable Living Trust
Purchase Details
Closed on
Sep 11, 2015
Sold by
Feithen Delores B
Bought by
Ward Bernard A
Purchase Details
Closed on
Oct 26, 1993
Sold by
First National Bank Of Lockport
Bought by
Barnes Gerald R
Home Financials for this Owner
Home Financials are based on the most recent Mortgage that was taken out on this home.
Original Mortgage
$25,000
Interest Rate
6.82%
Create a Home Valuation Report for This Property
The Home Valuation Report is an in-depth analysis detailing your home's value as well as a comparison with similar homes in the area
Home Values in the Area
Average Home Value in this Area
Purchase History
| Date | Buyer | Sale Price | Title Company |
|---|---|---|---|
| Capiak Maura S | $237,000 | Fidelity National Title | |
| Bernard A Ward Revocable Living Trust | -- | Attorney | |
| Ward Bernard A | $110,000 | Fidelity National Title Ins | |
| Barnes Gerald R | $80,000 | -- |
Source: Public Records
Mortgage History
| Date | Status | Borrower | Loan Amount |
|---|---|---|---|
| Open | Capiak Maura S | $107,000 | |
| Previous Owner | Barnes Gerald R | $25,000 |
Source: Public Records
Tax History Compared to Growth
Tax History
| Year | Tax Paid | Tax Assessment Tax Assessment Total Assessment is a certain percentage of the fair market value that is determined by local assessors to be the total taxable value of land and additions on the property. | Land | Improvement |
|---|---|---|---|---|
| 2024 | $3,582 | $57,719 | $9,131 | $48,588 |
| 2023 | $3,582 | $51,817 | $8,197 | $43,620 |
| 2022 | $3,393 | $47,857 | $7,571 | $40,286 |
| 2021 | $3,167 | $44,974 | $7,115 | $37,859 |
| 2020 | $3,059 | $43,495 | $6,881 | $36,614 |
| 2019 | $2,863 | $41,227 | $6,522 | $34,705 |
| 2018 | $2,779 | $39,641 | $6,271 | $33,370 |
| 2017 | $2,626 | $37,422 | $5,920 | $31,502 |
| 2016 | $3,212 | $37,511 | $5,934 | $31,577 |
| 2015 | $2,399 | $35,691 | $5,646 | $30,045 |
| 2014 | $2,399 | $34,652 | $5,482 | $29,170 |
| 2013 | $2,399 | $37,261 | $5,895 | $31,366 |
Source: Public Records
Map
Nearby Homes
- 1340 Lacoma Ct
- 1108 E 9th St
- 613 E 3rd St Unit 4
- 613 Katherine St
- 207 Muehl Dr
- 807 Valley Ln
- 602 Stephanie Dr
- 540 E 4th St
- 927 Putnam Dr
- 317 Bonnie Dr
- 1007 Read St
- 560 E 7th St
- 1004 Valley Ln
- 134 S Jefferson St
- 1221 Runyan Dr
- 1102 E Treeline Dr
- 1413 Strawberry Hill Dr
- 800 Madison St Unit 2C
- 219 S Washington St
- 1220 E Wellwood Dr
- 1056 Ashley Ct N Unit N2B
- 1056 Ashley Ct N Unit 21C
- 1056 Ashley Ct N Unit 3B
- 1056 Ashley Ct N Unit 2N1B
- 1056 Ashley Ct N Unit 2B
- 1056 Ashley Ct N Unit 3A
- 1056 Ashley Ct N Unit 2D
- 1056 Ashley Ct N Unit 23D
- 1056 Ashley Ct N Unit 23C
- 1056 Ashley Ct N Unit 22C
- 1056 Ashley Ct N Unit 1D
- 1056 Ashley Ct N Unit 2A
- 1056 Ashley Ct N Unit 2C
- 1056 Ashley Ct N Unit 3C
- 1056 Ashley Ct N Unit 1A
- 1056 Ashley Ct N Unit 3D
- 1044 Ashley Ct N Unit S2C
- 1044 Ashley Ct N Unit 33D
- 1044 Ashley Ct N Unit N1D
- 1044 Ashley Ct N Unit 2A