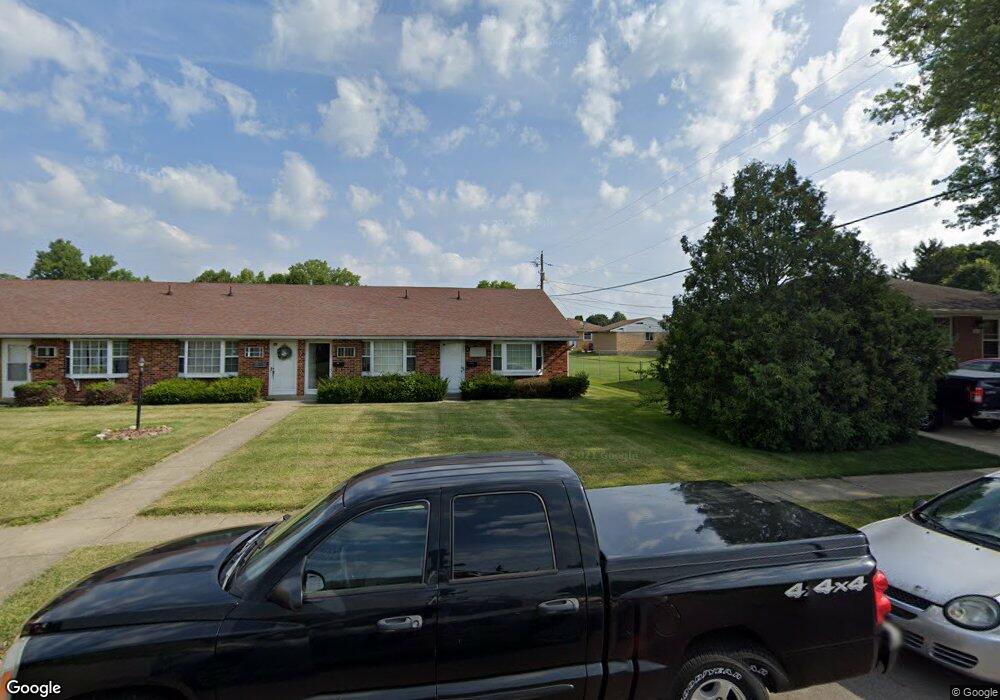
1056 Cheyenne Ave Springfield, OH 45503
Estimated Value: $101,328 - $107,000
1
Bed
1
Bath
636
Sq Ft
$164/Sq Ft
Est. Value
About This Home
This home is located at 1056 Cheyenne Ave, Springfield, OH 45503 and is currently estimated at $104,332, approximately $164 per square foot. 1056 Cheyenne Ave is a home located in Clark County with nearby schools including Northridge Elementary School, Kenton Ridge Middle & High School, and Emmanuel Christian Academy.
Ownership History
Date
Name
Owned For
Owner Type
Purchase Details
Closed on
Mar 13, 2018
Sold by
Clark Mary T
Bought by
Gross Debra J
Current Estimated Value
Home Financials for this Owner
Home Financials are based on the most recent Mortgage that was taken out on this home.
Original Mortgage
$50,440
Outstanding Balance
$42,876
Interest Rate
4.32%
Mortgage Type
New Conventional
Estimated Equity
$61,456
Purchase Details
Closed on
Dec 10, 2012
Sold by
Snider Mary Ellen
Bought by
Clark Mary T
Purchase Details
Closed on
Jun 28, 1994
Sold by
Spencer Georgia I
Bought by
Snider Mary Ellen
Home Financials for this Owner
Home Financials are based on the most recent Mortgage that was taken out on this home.
Original Mortgage
$27,000
Interest Rate
8.78%
Mortgage Type
New Conventional
Purchase Details
Closed on
Feb 10, 1993
Create a Home Valuation Report for This Property
The Home Valuation Report is an in-depth analysis detailing your home's value as well as a comparison with similar homes in the area
Home Values in the Area
Average Home Value in this Area
Purchase History
| Date | Buyer | Sale Price | Title Company |
|---|---|---|---|
| Gross Debra J | $52,000 | First American Mortgage Solu | |
| Clark Mary T | $49,900 | None Available | |
| Snider Mary Ellen | $39,000 | -- | |
| -- | $41,000 | -- |
Source: Public Records
Mortgage History
| Date | Status | Borrower | Loan Amount |
|---|---|---|---|
| Open | Gross Debra J | $50,440 | |
| Previous Owner | Snider Mary Ellen | $27,000 |
Source: Public Records
Tax History
| Year | Tax Paid | Tax Assessment Tax Assessment Total Assessment is a certain percentage of the fair market value that is determined by local assessors to be the total taxable value of land and additions on the property. | Land | Improvement |
|---|---|---|---|---|
| 2025 | $978 | $29,290 | $7,500 | $21,790 |
| 2024 | $946 | $22,370 | $6,830 | $15,540 |
| 2023 | $946 | $22,370 | $6,830 | $15,540 |
| 2022 | $950 | $22,370 | $6,830 | $15,540 |
| 2021 | $836 | $16,700 | $5,250 | $11,450 |
| 2020 | $837 | $16,700 | $5,250 | $11,450 |
| 2019 | $853 | $16,700 | $5,250 | $11,450 |
| 2018 | $400 | $16,270 | $4,940 | $11,330 |
| 2017 | $343 | $16,265 | $4,935 | $11,330 |
| 2016 | $341 | $16,265 | $4,935 | $11,330 |
| 2015 | $398 | $17,213 | $5,250 | $11,963 |
| 2014 | $398 | $17,213 | $5,250 | $11,963 |
| 2013 | $388 | $17,213 | $5,250 | $11,963 |
Source: Public Records
Map
Nearby Homes
- 4733 Curtis Dr
- 4741 Cullen Ave
- 4802 Willowbrook Dr
- 1341 Student Ave
- 4322 Midfield St Unit 15
- 4256 Midfield St Unit 9
- 4446 Ridgewood Rd E Unit 3
- 4577 Reno Ln Unit 2
- 4652 Reno Ln Unit 15
- 5033 Ridgewood Rd E
- 1162 Kingsgate Rd
- 1644 Delmar Dr
- 3942 Harris Ln
- 5235 W Ridgewood Rd
- 5300 Brookshire Ln
- 1201 Kingsgate Rd
- 4732 Lehigh Dr
- 1521 Erika Dr
- 1500 Kingsgate Rd Unit 19430
- 1502 Kingsgate Rd Unit 19432
- 1056 Cheyenne Ave
- 1056 Cheyenne Ave
- 1052 Cheyenne Ave Unit 1052
- 1060 Cheyenne Ave
- 1050 Cheyenne Ave Unit 1050
- 1050 Cheyenne Ave
- 1048 Cheyenne Ave Unit 1048
- 1048 Cheyenne Ave
- 1102 Cheyenne Ave
- 1044 Cheyenne Ave Unit 1044
- 1061 Blaine Ave
- 1040 Cheyenne Ave Unit 1040
- 1036 Cheyenne Ave
- 1036 Cheyenne Ave
- 1103 Blaine Ave
- 1063 Cheyenne Ave
- 1108 Cheyenne Ave
- 1055 Cheyenne Ave
- 1032 Cheyenne Ave Unit 1032
- 1053 Cheyenne Ave Unit 1053
Your Personal Tour Guide
Ask me questions while you tour the home.