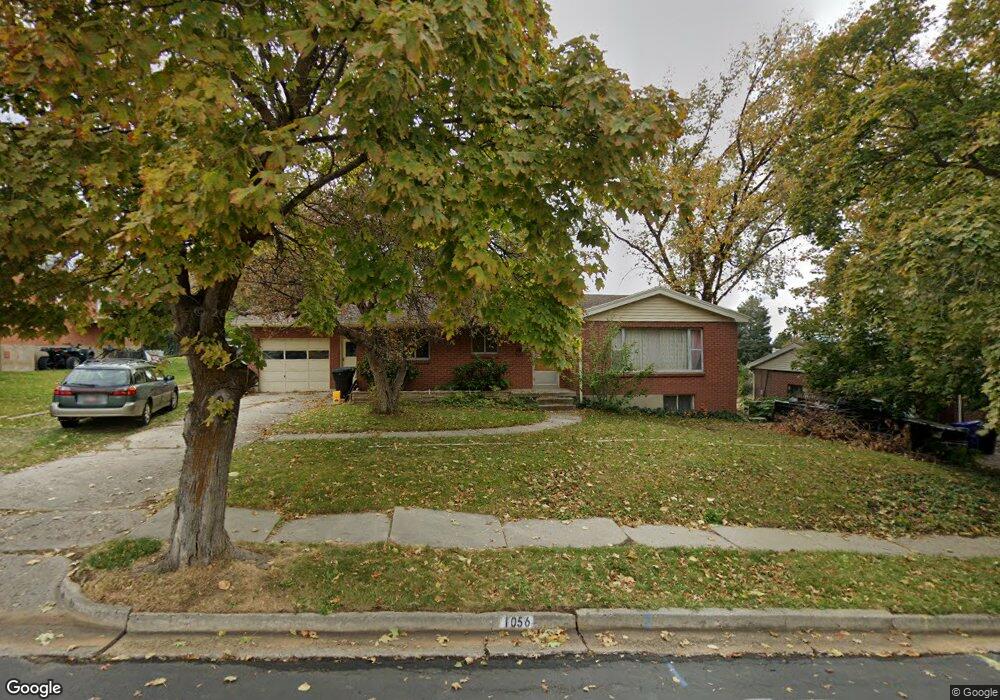
1056 E Center St Bountiful, UT 84010
Estimated Value: $479,000 - $539,000
3
Beds
2
Baths
1,099
Sq Ft
$457/Sq Ft
Est. Value
About This Home
This home is located at 1056 E Center St, Bountiful, UT 84010 and is currently estimated at $502,719, approximately $457 per square foot. 1056 E Center St is a home located in Davis County with nearby schools including Holbrook Elementary School, Millcreek Junior High School, and Bountiful High School.
Ownership History
Date
Name
Owned For
Owner Type
Purchase Details
Closed on
Dec 6, 2022
Sold by
Lawrence Nikolas A
Bought by
Lawrence Julie A
Current Estimated Value
Purchase Details
Closed on
Mar 9, 2012
Sold by
Lawrence Nikolas A and Lawrence Julie A
Bought by
Lawrence Julie A and Lwrence Nikolas A
Purchase Details
Closed on
Aug 22, 2011
Sold by
Lawrence Nikolas A
Bought by
Lawrence Nikolas A and Lawrence Julie A
Home Financials for this Owner
Home Financials are based on the most recent Mortgage that was taken out on this home.
Original Mortgage
$50,000
Interest Rate
4.53%
Mortgage Type
New Conventional
Purchase Details
Closed on
Aug 19, 2011
Sold by
Lawrence Julie A and Allen Robert D
Bought by
Lawrence Nikolas A
Home Financials for this Owner
Home Financials are based on the most recent Mortgage that was taken out on this home.
Original Mortgage
$50,000
Interest Rate
4.53%
Mortgage Type
New Conventional
Purchase Details
Closed on
Oct 16, 2007
Sold by
Allen Elaine M
Bought by
Allen Elaine M and Allen Robert D
Create a Home Valuation Report for This Property
The Home Valuation Report is an in-depth analysis detailing your home's value as well as a comparison with similar homes in the area
Purchase History
| Date | Buyer | Sale Price | Title Company |
|---|---|---|---|
| Lawrence Julie A | -- | Accommodation/Courtesy Recordi | |
| Lawrence Julie A | -- | Western States Title Company | |
| Lawrence Nikolas A | -- | Hickman Land Title Co | |
| Lawrence Nikolas A | -- | Hickman Land Title Co | |
| Allen Elaine M | -- | None Available |
Source: Public Records
Mortgage History
| Date | Status | Borrower | Loan Amount |
|---|---|---|---|
| Previous Owner | Lawrence Nikolas A | $50,000 |
Source: Public Records
Tax History
| Year | Tax Paid | Tax Assessment Tax Assessment Total Assessment is a certain percentage of the fair market value that is determined by local assessors to be the total taxable value of land and additions on the property. | Land | Improvement |
|---|---|---|---|---|
| 2025 | $2,690 | $241,450 | $127,852 | $113,598 |
| 2024 | $2,520 | $235,400 | $117,971 | $117,429 |
| 2023 | $2,419 | $410,000 | $212,714 | $197,286 |
| 2022 | $2,549 | $237,600 | $113,103 | $124,497 |
| 2021 | $2,171 | $308,000 | $168,003 | $139,997 |
| 2020 | $1,909 | $271,000 | $153,002 | $117,998 |
| 2019 | $1,925 | $267,000 | $153,371 | $113,629 |
| 2018 | $1,784 | $243,000 | $142,109 | $100,891 |
| 2016 | $1,557 | $114,895 | $44,312 | $70,583 |
| 2015 | $1,540 | $107,306 | $43,863 | $63,443 |
| 2014 | $1,492 | $107,021 | $43,863 | $63,158 |
| 2013 | -- | $93,504 | $52,302 | $41,202 |
Source: Public Records
Map
Nearby Homes
- 1138 Briggs Dr
- 6 N 800 E
- 129 N 800 E
- 683 E 100 N
- 908 Northern Hills Dr Unit 3
- 331 S 1550 E Unit 3
- 933 Northern Hills Cir
- 144 Bountiful Blvd
- 1342 E Skyline Dr N Unit 30
- 456 E 500 S
- 111 Eagle Ridge Dr
- 513 N 400 E Unit 14B
- 520 S Orchard Dr Unit 17
- 453 N 400 E Unit 7-D
- 861 E Millbrook Way
- 323 Peach Ln
- 275 E Peach Ln S
- 255 E 400 S
- 0 Lot Bountiful Blvd
- 795 Abby Ln Unit 5
- 1068 E Center St
- 1044 E Center St
- 1069 E 75 S
- 1065 E 75 S
- 1077 E 75 S
- 1032 E Center St
- 1080 E Center St
- 1063 E Center St
- 1051 E Center St
- 1055 E 75 S
- 1083 E 75 S
- 1039 E Center St
- 1075 E Center St
- 1090 E Center St
- 1020 E Center St
- 16 S Davis Blvd
- 77 N 1050 E
- 77 N 1050 E Unit 80
- 1025 E Center St
- 1043 E 75 S
Your Personal Tour Guide
Ask me questions while you tour the home.