Estimated Value: $485,000 - $520,000
4
Beds
3
Baths
1,920
Sq Ft
$258/Sq Ft
Est. Value
About This Home
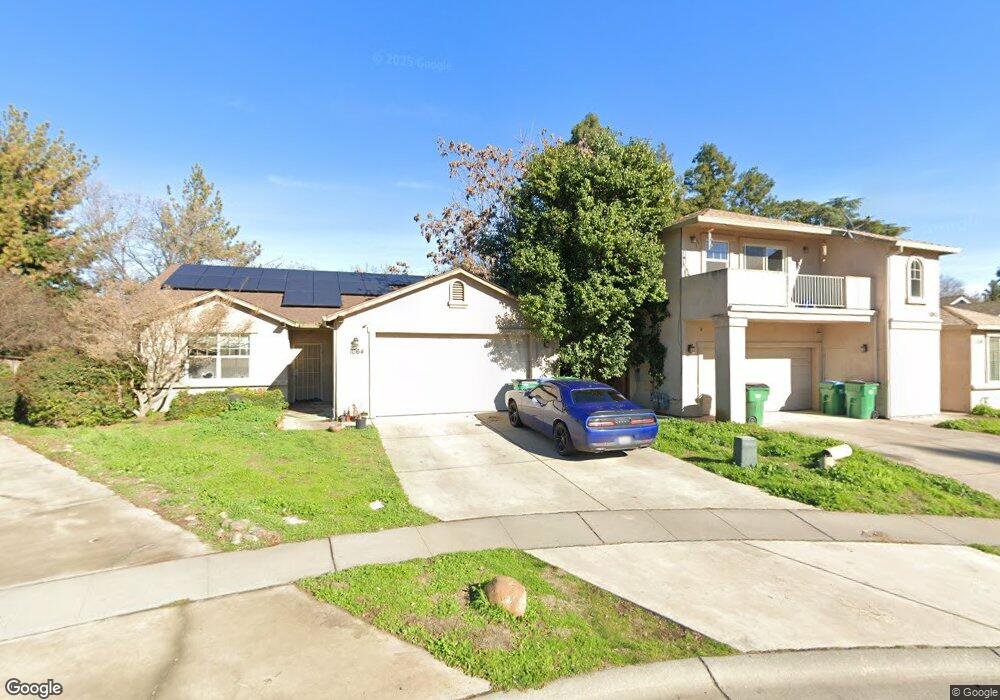
This home is located at 1056 Raven Ln, Chico, CA 95926 and is currently estimated at $495,299, approximately $257 per square foot. 1056 Raven Ln is a home located in Butte County with nearby schools including Emma Wilson Elementary School, Chico Junior High School, and Chico High School.
Ownership History
Date
Name
Owned For
Owner Type
Purchase Details
Closed on
Jul 27, 2020
Sold by
Scott Richard J
Bought by
Scott Richard J and Scott Family Trust
Current Estimated Value
Purchase Details
Closed on
Oct 25, 2019
Sold by
Scott Richard J and The Scott Family Trust
Bought by
Scott Richard J
Home Financials for this Owner
Home Financials are based on the most recent Mortgage that was taken out on this home.
Original Mortgage
$282,000
Outstanding Balance
$188,956
Interest Rate
3.7%
Mortgage Type
New Conventional
Estimated Equity
$306,343
Purchase Details
Closed on
Jun 26, 2017
Sold by
Scott Ricahrd J
Bought by
Scott Richard J and The Scott Family Trust
Purchase Details
Closed on
Oct 4, 2004
Sold by
Marcon Inc
Bought by
Scott Richard J
Home Financials for this Owner
Home Financials are based on the most recent Mortgage that was taken out on this home.
Original Mortgage
$289,800
Interest Rate
8.75%
Mortgage Type
Purchase Money Mortgage
Create a Home Valuation Report for This Property
The Home Valuation Report is an in-depth analysis detailing your home's value as well as a comparison with similar homes in the area
Purchase History
| Date | Buyer | Sale Price | Title Company |
|---|---|---|---|
| Scott Richard J | -- | None Available | |
| Scott Richard J | -- | Stewart Title Of California | |
| Scott Richard J | -- | None Available | |
| Scott Richard J | $322,000 | Mid Valley Title & Escrow Co |
Source: Public Records
Mortgage History
| Date | Status | Borrower | Loan Amount |
|---|---|---|---|
| Open | Scott Richard J | $282,000 | |
| Closed | Scott Richard J | $289,800 |
Source: Public Records
Tax History
| Year | Tax Paid | Tax Assessment Tax Assessment Total Assessment is a certain percentage of the fair market value that is determined by local assessors to be the total taxable value of land and additions on the property. | Land | Improvement |
|---|---|---|---|---|
| 2025 | $5,075 | $448,816 | $139,378 | $309,438 |
| 2024 | $5,075 | $440,017 | $136,646 | $303,371 |
| 2023 | $4,986 | $431,390 | $133,967 | $297,423 |
| 2022 | $4,895 | $422,933 | $131,341 | $291,592 |
| 2021 | $4,806 | $414,641 | $128,766 | $285,875 |
| 2020 | $4,857 | $410,390 | $127,446 | $282,944 |
| 2019 | $4,732 | $402,345 | $124,948 | $277,397 |
| 2018 | $4,546 | $394,457 | $122,499 | $271,958 |
| 2017 | $4,571 | $386,724 | $120,098 | $266,626 |
| 2016 | $4,097 | $379,143 | $117,744 | $261,399 |
| 2015 | $3,724 | $335,000 | $110,000 | $225,000 |
| 2014 | $3,623 | $323,000 | $110,000 | $213,000 |
Source: Public Records
Map
Nearby Homes
- 1025 Raven Ln
- 1395 Nord Ave
- 1397 Nord Ave
- 1036 Clotilde Way
- 65 Knightsbridge Ln
- 30 Clairidge Ln
- 1114 Nord Ave
- 1114 Nord Ave Unit 17
- 30 Fairgate Ln
- 736 Leafcrest Dr
- 1044 Southampton Dr
- 757 Hillgrove Ct
- 1110 W 8th Ave Unit 1
- 1110 W 8th Ave Unit 4
- 810 W 1st Ave
- 811 W 2nd Ave
- 12 Klondike Ct
- 1 4 Acre Ct
- 642 W 1st Ave
- 2135 Nord Ave Unit 13
Your Personal Tour Guide
Ask me questions while you tour the home.