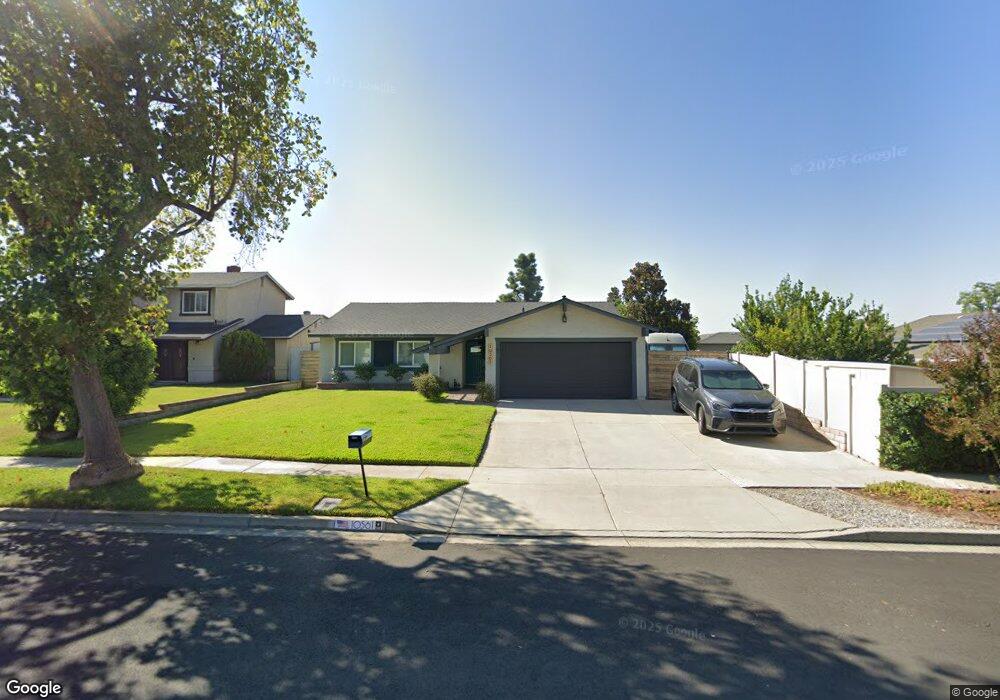
10561 Gala Ave Rancho Cucamonga, CA 91701
Estimated Value: $711,991 - $772,000
3
Beds
2
Baths
1,315
Sq Ft
$570/Sq Ft
Est. Value
About This Home
This home is located at 10561 Gala Ave, Rancho Cucamonga, CA 91701 and is currently estimated at $748,998, approximately $569 per square foot. 10561 Gala Ave is a home located in San Bernardino County with nearby schools including Victoria Groves Elementary, Vineyard Junior High, and Los Osos High.
Ownership History
Date
Name
Owned For
Owner Type
Purchase Details
Closed on
Oct 25, 2011
Sold by
Department Of Veterans Affairs Of The St
Bought by
Rosales Randall R and Rosales Ellie
Current Estimated Value
Home Financials for this Owner
Home Financials are based on the most recent Mortgage that was taken out on this home.
Original Mortgage
$289,900
Outstanding Balance
$196,863
Interest Rate
4.01%
Mortgage Type
VA
Estimated Equity
$552,135
Purchase Details
Closed on
Sep 28, 2011
Sold by
Rosales Randall R and Rosales Ellie
Bought by
Kautzer Phillip Ryan and Kautzer Natalie Angela
Home Financials for this Owner
Home Financials are based on the most recent Mortgage that was taken out on this home.
Original Mortgage
$289,900
Outstanding Balance
$196,863
Interest Rate
4.01%
Mortgage Type
VA
Estimated Equity
$552,135
Purchase Details
Closed on
Jul 24, 1995
Sold by
Malki Timothy E
Bought by
Va
Create a Home Valuation Report for This Property
The Home Valuation Report is an in-depth analysis detailing your home's value as well as a comparison with similar homes in the area
Home Values in the Area
Average Home Value in this Area
Purchase History
| Date | Buyer | Sale Price | Title Company |
|---|---|---|---|
| Rosales Randall R | -- | Lawyers Title | |
| Kautzer Phillip Ryan | $290,000 | Lawyers Title | |
| Va | $136,000 | Fidelity National Title Ins |
Source: Public Records
Mortgage History
| Date | Status | Borrower | Loan Amount |
|---|---|---|---|
| Open | Kautzer Phillip Ryan | $289,900 |
Source: Public Records
Tax History Compared to Growth
Tax History
| Year | Tax Paid | Tax Assessment Tax Assessment Total Assessment is a certain percentage of the fair market value that is determined by local assessors to be the total taxable value of land and additions on the property. | Land | Improvement |
|---|---|---|---|---|
| 2025 | $3,882 | $364,132 | $91,034 | $273,098 |
| 2024 | $3,882 | $356,992 | $89,249 | $267,743 |
| 2023 | $3,794 | $349,992 | $87,499 | $262,493 |
| 2022 | $3,783 | $343,129 | $85,783 | $257,346 |
| 2021 | $3,780 | $336,401 | $84,101 | $252,300 |
| 2020 | $3,624 | $332,952 | $83,239 | $249,713 |
| 2019 | $3,664 | $326,424 | $81,607 | $244,817 |
| 2018 | $3,580 | $320,024 | $80,007 | $240,017 |
| 2017 | $3,416 | $313,749 | $78,438 | $235,311 |
| 2016 | $3,322 | $307,597 | $76,900 | $230,697 |
| 2015 | $3,300 | $302,977 | $75,745 | $227,232 |
| 2014 | $3,206 | $297,042 | $74,261 | $222,781 |
Source: Public Records
Map
Nearby Homes
- 10456 Hamilton St
- 10414 Hamilton St
- 6842 Palm Dr
- 10672 Finch Ave
- 6516 Alameda Ave
- 6959 Center Ave
- 10655 Lemon Ave Unit 2703
- 10655 Lemon Ave Unit 2605
- 10655 Lemon Ave Unit 3613
- 10655 Lemon Ave Unit 4004
- 10655 Lemon Ave Unit 1710
- 10655 Lemon Ave Unit 4009
- 10655 Lemon Ave Unit 1508
- 10655 Lemon Ave Unit 2402
- 10655 Lemon Ave Unit 3912
- 7055 Mango St
- 10815 Plumas Rd
- 6644 Brissac Place
- 6572 San Benito Ave
- 6915 Stanislaus Place
- 10571 Gala Ave
- 6741 Dakota Ave
- 6749 Dakota Ave
- 6759 Dakota Ave
- 10576 Valinda Ct
- 6742 Valinda Ave
- 6748 Valinda Ave
- 10572 Valinda Ct
- 6769 Dakota Ave
- 10556 Gala Ave
- 10566 Gala Ave
- 10584 Valinda Ct
- 10576 Gala Ave
- 10548 Gala Ave
- 6777 Dakota Ave
- 10584 Gala Ave
- 10540 Gala Ave
- 6748 Dakota Ave
- 6740 Dakota Ave
- 6756 Dakota Ave