Estimated Value: $428,000 - $656,983
3
Beds
2
Baths
2,152
Sq Ft
$252/Sq Ft
Est. Value
About This Home
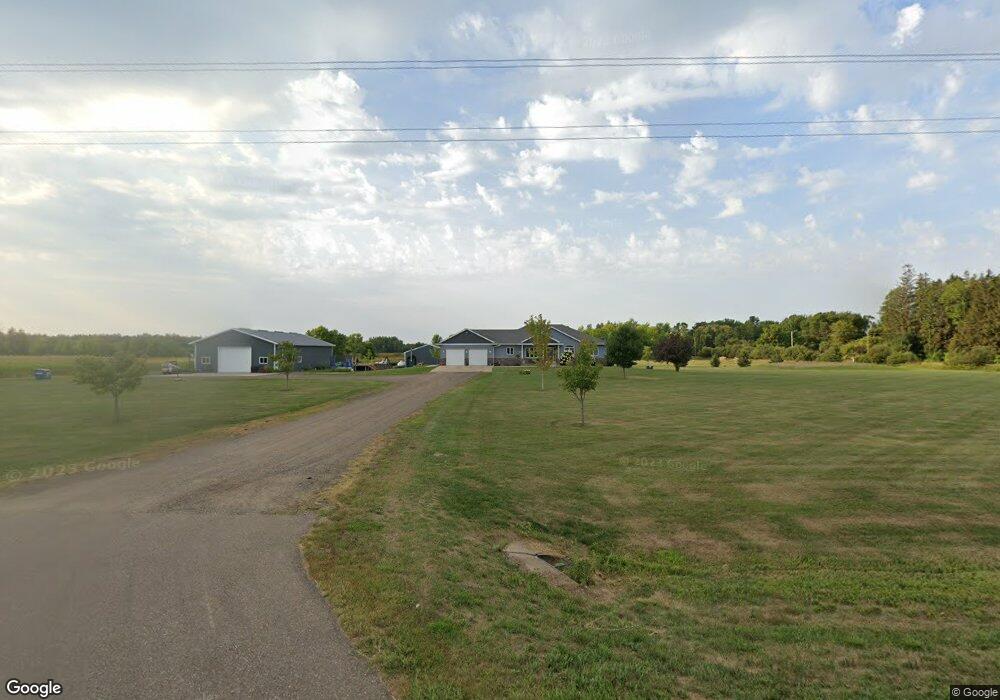
This home is located at 10566 Little Rock Rd NE, Foley, MN 56329 and is currently estimated at $542,492, approximately $252 per square foot. 10566 Little Rock Rd NE is a home located in Benton County with nearby schools including Foley Elementary School, Foley Intermediate Elementary School, and Foley Senior High School.
Ownership History
Date
Name
Owned For
Owner Type
Purchase Details
Closed on
Jun 26, 2006
Sold by
Spiczka Claude and Spiczka Leroy
Bought by
Zimmer Richard T and Zimmer Linda J
Current Estimated Value
Home Financials for this Owner
Home Financials are based on the most recent Mortgage that was taken out on this home.
Original Mortgage
$70,000
Outstanding Balance
$49,394
Interest Rate
10.5%
Mortgage Type
Future Advance Clause Open End Mortgage
Estimated Equity
$493,098
Purchase Details
Closed on
Jun 22, 2006
Sold by
Quade Jason C and Quade Christine L
Bought by
Pozorski Todd J and Pozorski Melissa J
Home Financials for this Owner
Home Financials are based on the most recent Mortgage that was taken out on this home.
Original Mortgage
$70,000
Outstanding Balance
$49,394
Interest Rate
10.5%
Mortgage Type
Future Advance Clause Open End Mortgage
Estimated Equity
$493,098
Create a Home Valuation Report for This Property
The Home Valuation Report is an in-depth analysis detailing your home's value as well as a comparison with similar homes in the area
Home Values in the Area
Average Home Value in this Area
Purchase History
| Date | Buyer | Sale Price | Title Company |
|---|---|---|---|
| Zimmer Richard T | $53,457 | -- | |
| Pozorski Todd J | $70,000 | -- |
Source: Public Records
Mortgage History
| Date | Status | Borrower | Loan Amount |
|---|---|---|---|
| Open | Pozorski Todd J | $70,000 |
Source: Public Records
Tax History Compared to Growth
Tax History
| Year | Tax Paid | Tax Assessment Tax Assessment Total Assessment is a certain percentage of the fair market value that is determined by local assessors to be the total taxable value of land and additions on the property. | Land | Improvement |
|---|---|---|---|---|
| 2025 | $6,284 | $651,100 | $102,300 | $548,800 |
| 2024 | $5,348 | $619,000 | $101,000 | $518,000 |
| 2023 | $4,832 | $578,900 | $101,000 | $477,900 |
| 2022 | $4,770 | $490,000 | $89,700 | $400,300 |
| 2021 | $4,764 | $423,400 | $79,400 | $344,000 |
| 2018 | $4,184 | $360,900 | $74,837 | $286,063 |
| 2017 | $4,184 | $294,600 | $73,971 | $220,629 |
| 2016 | $4,096 | $291,500 | $70,800 | $220,700 |
| 2015 | $3,966 | $250,300 | $67,516 | $182,784 |
| 2014 | -- | $251,500 | $66,331 | $185,169 |
| 2013 | -- | $269,400 | $80,672 | $188,728 |
Source: Public Records
Map
Nearby Homes
- 1xxx 105th Ave NE
- 11665 103rd Ave NE
- 9360 85th St NE
- TBD Field House Rd
- 709 Norman Ave N
- XXX Hwy 25
- 501 4th Ave N
- 409 4th Ave N
- 330 7th Ave
- TBD 11th Ave
- 131 Norman Ave N
- 52 Glen St Unit 10
- 130 Broadway Ave S
- 191 4th Ave S
- 201 Norman Ave S
- 320 Oak Dr
- 142xx 80th St NE
- 400 Kathryn Ln
- TBD 90th St NE
- 6468 75th Ave NE