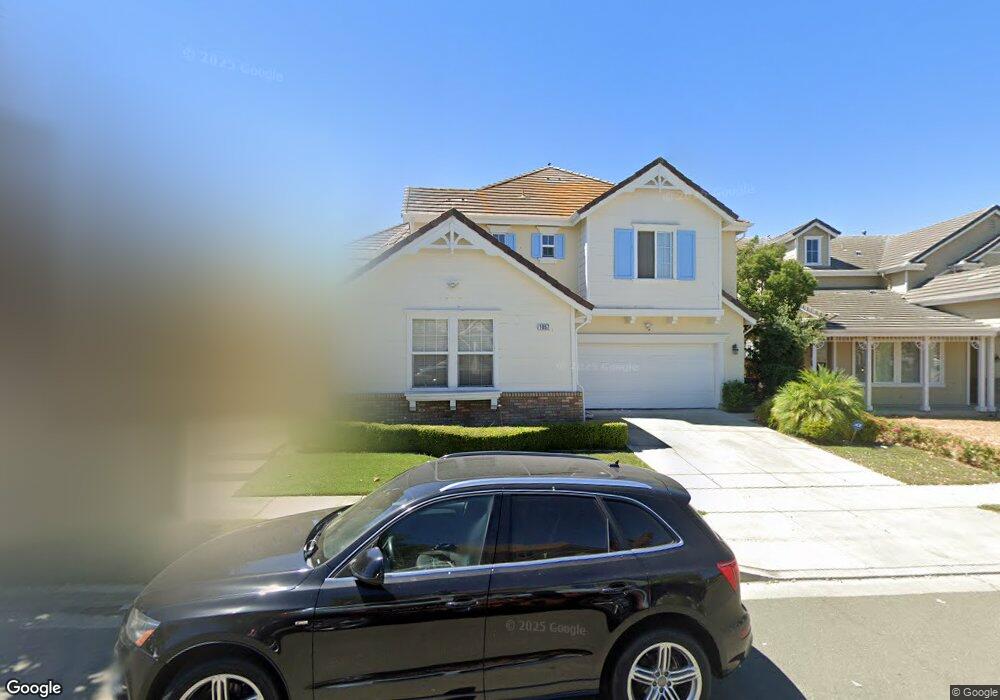
1057 Rock Harbor Point Hercules, CA 94547
New Pacific NeighborhoodEstimated Value: $1,219,000 - $1,399,000
5
Beds
4
Baths
3,410
Sq Ft
$385/Sq Ft
Est. Value
About This Home
This home is located at 1057 Rock Harbor Point, Hercules, CA 94547 and is currently estimated at $1,313,781, approximately $385 per square foot. 1057 Rock Harbor Point is a home located in Contra Costa County with nearby schools including Lupine Hills Elementary School, Hercules Middle School, and Hercules High School.
Ownership History
Date
Name
Owned For
Owner Type
Purchase Details
Closed on
Apr 28, 2025
Sold by
Lal Shivcharanjit and Lal Sunita
Bought by
Lal Sukhdeep and Judge Samerpreet Kaur
Current Estimated Value
Purchase Details
Closed on
Mar 23, 2022
Sold by
Lal Silivcharanjit K and Lal Sunita K
Bought by
Lal 2022 Revocable Family Trust
Purchase Details
Closed on
Nov 4, 2013
Sold by
Smrekar Amanda J
Bought by
Lal Shivcharanjit and Lal Sunita K
Purchase Details
Closed on
Nov 15, 2012
Sold by
Carneiro Fernando L
Bought by
Smrekar Amanda J
Purchase Details
Closed on
Aug 18, 2004
Sold by
Warmington Hercules Associates Lp
Bought by
Smrekar Amanda J and Carneiro Fernando L
Home Financials for this Owner
Home Financials are based on the most recent Mortgage that was taken out on this home.
Original Mortgage
$656,240
Interest Rate
3.81%
Mortgage Type
Negative Amortization
Create a Home Valuation Report for This Property
The Home Valuation Report is an in-depth analysis detailing your home's value as well as a comparison with similar homes in the area
Home Values in the Area
Average Home Value in this Area
Purchase History
| Date | Buyer | Sale Price | Title Company |
|---|---|---|---|
| Lal Sukhdeep | -- | None Listed On Document | |
| Lal 2022 Revocable Family Trust | -- | Watson Hoffe & Hass By Peter A | |
| Lal Shivcharanjit | $789,000 | Old Republic Title Company | |
| Smrekar Amanda J | -- | None Available | |
| Smrekar Amanda J | $800,500 | First American Title |
Source: Public Records
Mortgage History
| Date | Status | Borrower | Loan Amount |
|---|---|---|---|
| Previous Owner | Smrekar Amanda J | $656,240 |
Source: Public Records
Tax History Compared to Growth
Tax History
| Year | Tax Paid | Tax Assessment Tax Assessment Total Assessment is a certain percentage of the fair market value that is determined by local assessors to be the total taxable value of land and additions on the property. | Land | Improvement |
|---|---|---|---|---|
| 2025 | $14,323 | $967,193 | $231,681 | $735,512 |
| 2024 | $14,323 | $948,230 | $227,139 | $721,091 |
| 2023 | $14,069 | $929,638 | $222,686 | $706,952 |
| 2022 | $13,888 | $911,411 | $218,320 | $693,091 |
| 2021 | $13,875 | $893,541 | $214,040 | $679,501 |
| 2019 | $13,125 | $867,041 | $207,693 | $659,348 |
| 2018 | $12,718 | $850,041 | $203,621 | $646,420 |
| 2017 | $12,508 | $833,375 | $199,629 | $633,746 |
| 2016 | $12,320 | $817,035 | $195,715 | $621,320 |
| 2015 | $12,348 | $804,764 | $192,776 | $611,988 |
| 2014 | $12,247 | $789,000 | $189,000 | $600,000 |
Source: Public Records
Map
Nearby Homes
- 1051 Rock Harbor Point
- 1063 Rock Harbor Point
- 1045 Rock Harbor Point
- 1069 Rock Harbor Point
- 1060 Rock Harbor Point
- 1054 Rock Harbor Point
- 1048 Rock Harbor Point
- 1039 Rock Harbor Point
- 1075 Rock Harbor Point
- 1066 Rock Harbor Point
- 1042 Rock Harbor Point
- 1081 Rock Harbor Point
- 1072 Rock Harbor Point
- 1036 Rock Harbor Point
- 1093 N Shelter Bay
- 1099 N Shelter Bay
- 1087 N Shelter Bay
- 1033 Rock Harbor Point
- 1087 Rock Harbor Point
- 1078 Rock Harbor Point