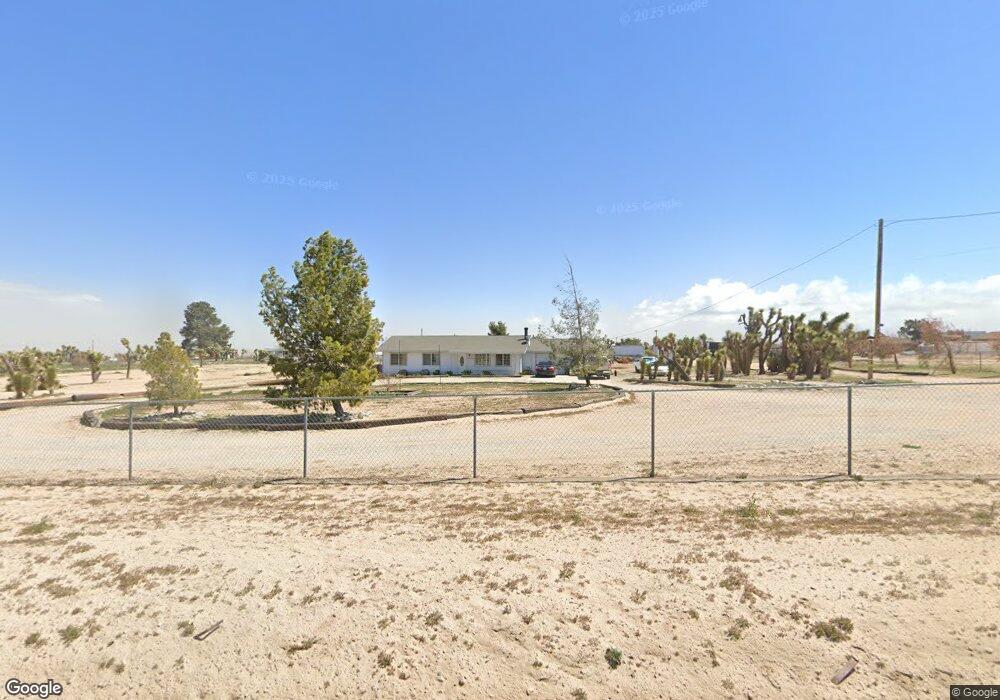
10573 Anderson Ranch Rd Unit 247 Phelan, CA 92371
Estimated Value: $417,000 - $473,599
3
Beds
2
Baths
1,796
Sq Ft
$252/Sq Ft
Est. Value
About This Home
This home is located at 10573 Anderson Ranch Rd Unit 247, Phelan, CA 92371 and is currently estimated at $452,900, approximately $252 per square foot. 10573 Anderson Ranch Rd Unit 247 is a home located in San Bernardino County with nearby schools including Phelan Elementary School, Quail Valley Middle School, and Serrano High School.
Ownership History
Date
Name
Owned For
Owner Type
Purchase Details
Closed on
Jun 11, 2018
Sold by
Saul Leo Herbert and Saul Nanette
Bought by
Deanda Daniel
Current Estimated Value
Home Financials for this Owner
Home Financials are based on the most recent Mortgage that was taken out on this home.
Original Mortgage
$245,471
Outstanding Balance
$212,291
Interest Rate
4.5%
Mortgage Type
FHA
Estimated Equity
$240,609
Purchase Details
Closed on
Mar 5, 2012
Sold by
Deutsche Bank National Trust Company
Bought by
Saul Leo and Saul Nanette
Home Financials for this Owner
Home Financials are based on the most recent Mortgage that was taken out on this home.
Original Mortgage
$78,691
Interest Rate
3.5%
Mortgage Type
FHA
Purchase Details
Closed on
Nov 30, 2011
Sold by
Rosta Geary Wayne and Rosta Kimberly Lynn
Bought by
Deutsche Bank National Trust Company
Create a Home Valuation Report for This Property
The Home Valuation Report is an in-depth analysis detailing your home's value as well as a comparison with similar homes in the area
Home Values in the Area
Average Home Value in this Area
Purchase History
| Date | Buyer | Sale Price | Title Company |
|---|---|---|---|
| Deanda Daniel | $250,000 | Fidelity National Title | |
| Saul Leo | $100,000 | Lsi Title Company | |
| Deutsche Bank National Trust Company | $103,700 | Spl Title Services |
Source: Public Records
Mortgage History
| Date | Status | Borrower | Loan Amount |
|---|---|---|---|
| Open | Deanda Daniel | $245,471 | |
| Previous Owner | Saul Leo | $78,691 |
Source: Public Records
Tax History Compared to Growth
Tax History
| Year | Tax Paid | Tax Assessment Tax Assessment Total Assessment is a certain percentage of the fair market value that is determined by local assessors to be the total taxable value of land and additions on the property. | Land | Improvement |
|---|---|---|---|---|
| 2025 | $3,258 | $278,880 | $55,776 | $223,104 |
| 2024 | $3,258 | $273,411 | $54,682 | $218,729 |
| 2023 | $3,220 | $268,050 | $53,610 | $214,440 |
| 2022 | $3,145 | $262,794 | $52,559 | $210,235 |
| 2021 | $3,087 | $257,641 | $51,528 | $206,113 |
| 2020 | $3,048 | $255,000 | $51,000 | $204,000 |
| 2019 | $2,989 | $250,000 | $50,000 | $200,000 |
| 2018 | $1,409 | $126,949 | $22,078 | $104,871 |
| 2017 | $1,383 | $124,460 | $21,645 | $102,815 |
| 2016 | $1,364 | $122,020 | $21,221 | $100,799 |
| 2015 | $1,346 | $120,187 | $20,902 | $99,285 |
| 2014 | $1,323 | $117,833 | $20,493 | $97,340 |
Source: Public Records
Map
Nearby Homes
- 10601 Anderson Ranch Rd
- 0 Mira Mar Rd Unit HD25085289
- 0 Rochester Unit IV25071086
- 0 Tricobble Ct Unit HD25067680
- 0 Tricobble Ct Unit HD25067656
- 0 Vacant Land Unit OC25033384
- 0 Bear Valley Duncan Rd Unit HD22234467
- 5755 Coyote Rd
- 18 AC Eaby Rd
- 19 AC Eaby Rd
- 0 0 Unit 23-332217
- 0 Eaby Rd Unit IV25190794
- 0 Eaby Rd Unit HD25157986
- 0 Eaby Rd Unit IV25154513
- 0 Eaby Rd Unit HD23111448
- 0 Smith S Unit IV25220106
- 11065 Pacific Rd
- 0 Ailanthus St Unit CV22234484
- 1 Wilson Ranch Rd
- 8637 Wilson Ranch Rd
- 10573 Anderson Ranch Rd
- 10655 Anderson Ranch Rd
- 10570 Smith Rd
- 6078 Smoke Tree Rd
- 5980 Smoke Tree Rd
- 10632 Anderson Ranch Rd
- 10655 Smith Rd
- 5959 Smoke Tree Rd
- 5922 Smoke Tree Rd
- 5949 Coyote Rd
- 10677 Smith Rd
- 0 Smoke Tree Rd Unit CV18190071
- 0 Smoke Tree Rd Unit OC15012461
- 0 Smoke Tree Rd Unit WS15214834
- 0 Smoke Tree Rd Unit WS16078572
- 0 Smoke Tree Rd Unit DW16129429
- 0 Smoke Tree St Unit CV16750899
- 0 Smoke Tree Rd Unit EV16762769
- 0 Smoke Tree Rd Unit CRHD24039336