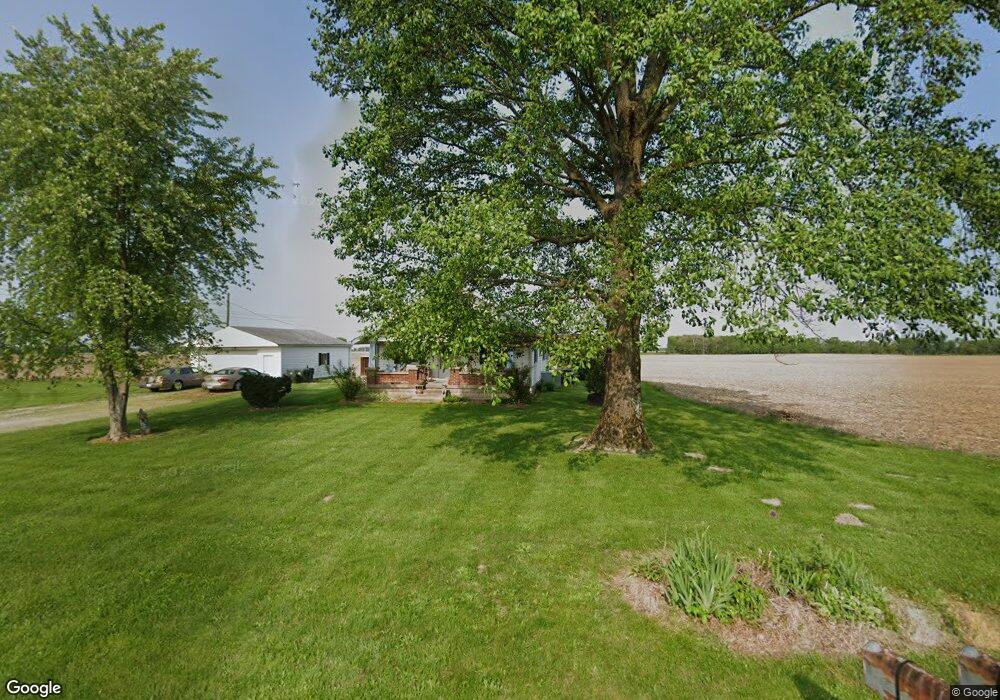
10575 N 200 W Fountaintown, IN 46130
Estimated Value: $169,656 - $218,000
3
Beds
1
Bath
904
Sq Ft
$213/Sq Ft
Est. Value
About This Home
This home is located at 10575 N 200 W, Fountaintown, IN 46130 and is currently estimated at $192,414, approximately $212 per square foot. 10575 N 200 W is a home located in Shelby County with nearby schools including Morristown Elementary School and Morristown Junior/Senior High School.
Ownership History
Date
Name
Owned For
Owner Type
Purchase Details
Closed on
Feb 6, 2025
Sold by
Boring Timothy D
Bought by
Timothy D Boring Revocable Living Trust and Boring
Current Estimated Value
Purchase Details
Closed on
Dec 7, 2023
Sold by
Marvin E And Cecila L Boring Living Trus
Bought by
Boring Timothy D
Purchase Details
Closed on
Sep 22, 2015
Sold by
Boring Cecila L and The Marvin E And Cecila L Bori
Bought by
Boring Cecila L and The Marvin E And Cecila L Bori
Purchase Details
Closed on
Sep 24, 2009
Sold by
Boring Cecila L
Bought by
Marvin E And Cecila L Boring Living Trus
Create a Home Valuation Report for This Property
The Home Valuation Report is an in-depth analysis detailing your home's value as well as a comparison with similar homes in the area
Home Values in the Area
Average Home Value in this Area
Purchase History
| Date | Buyer | Sale Price | Title Company |
|---|---|---|---|
| Timothy D Boring Revocable Living Trust | -- | None Listed On Document | |
| Boring Timothy D | -- | None Listed On Document | |
| Boring Cecila L | -- | None Available | |
| Marvin E And Cecila L Boring Living Trus | -- | -- |
Source: Public Records
Tax History Compared to Growth
Tax History
| Year | Tax Paid | Tax Assessment Tax Assessment Total Assessment is a certain percentage of the fair market value that is determined by local assessors to be the total taxable value of land and additions on the property. | Land | Improvement |
|---|---|---|---|---|
| 2024 | $608 | $111,100 | $16,700 | $94,400 |
| 2023 | $566 | $107,700 | $16,700 | $91,000 |
| 2022 | $1,663 | $104,300 | $16,700 | $87,600 |
| 2021 | $1,551 | $96,500 | $16,700 | $79,800 |
| 2020 | $1,457 | $93,300 | $16,700 | $76,600 |
| 2019 | $1,285 | $83,300 | $16,300 | $67,000 |
| 2018 | $1,188 | $77,000 | $16,300 | $60,700 |
| 2017 | $1,199 | $81,500 | $16,300 | $65,200 |
| 2016 | $1,146 | $83,800 | $16,300 | $67,500 |
| 2014 | $1,028 | $77,300 | $15,200 | $62,100 |
| 2013 | $1,028 | $74,600 | $14,700 | $59,900 |
Source: Public Records
Map
Nearby Homes
- 11546 N Shelby 300 W
- 5 U S 52
- 6 U S 52
- 5465 S Greenfield St
- 1069 W Railroad St
- 5477 S Main St
- 10686 N Division Rd
- 256 E 1000 N
- 11497 N State Road 9
- 83 E Walnut St
- 11131 N State Road 9
- 661 W 500 S
- 11600 N 100 E
- 4500 S 50 W
- 5555 S 200 E
- 1546 E Osprey Dr
- 1898 E 1000 N
- 4673 S 400 W
- 1556 E 400 S
- 3720 W 600 S