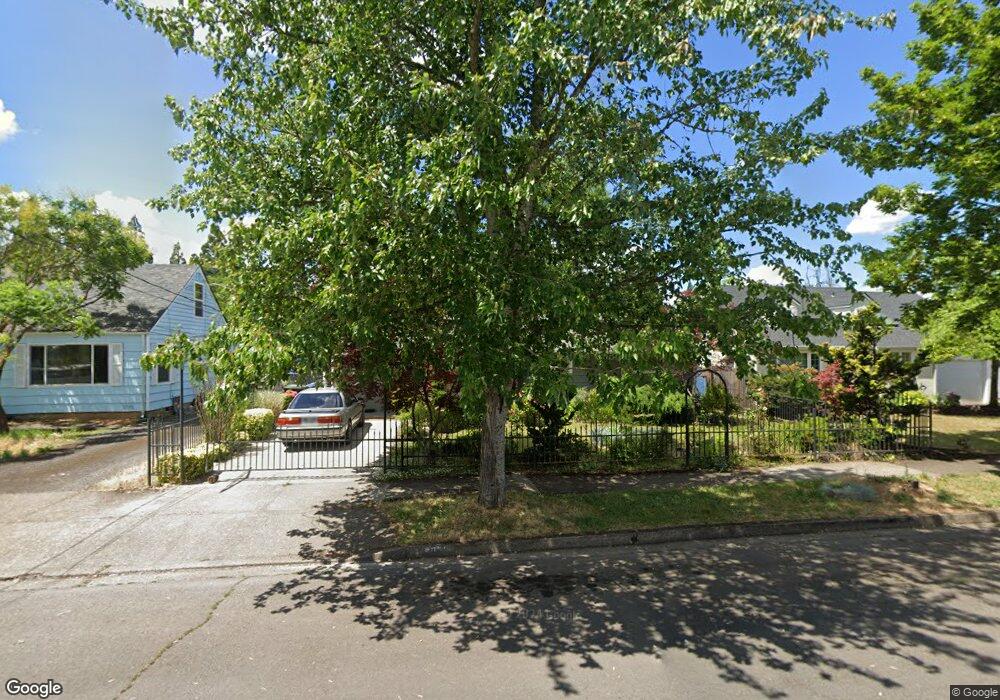
1058 3rd Place Springfield, OR 97477
Midtown South Springfield NeighborhoodEstimated Value: $238,000 - $323,193
2
Beds
1
Bath
855
Sq Ft
$327/Sq Ft
Est. Value
About This Home
This home is located at 1058 3rd Place, Springfield, OR 97477 and is currently estimated at $279,798, approximately $327 per square foot. 1058 3rd Place is a home located in Lane County with nearby schools including Two Rivers Dos Rios Elementary School, Hamlin Middle School, and Springfield High School.
Ownership History
Date
Name
Owned For
Owner Type
Purchase Details
Closed on
Sep 17, 2002
Sold by
Federal Home Loan Mortgage Corporation
Bought by
Vergara Feliciano and Cruz Rosa Elba
Current Estimated Value
Home Financials for this Owner
Home Financials are based on the most recent Mortgage that was taken out on this home.
Original Mortgage
$92,449
Outstanding Balance
$38,251
Interest Rate
6.24%
Mortgage Type
FHA
Estimated Equity
$241,547
Purchase Details
Closed on
Aug 13, 2002
Sold by
First Horizon Home Loan Corp
Bought by
Federal Home Loan Mortgage Corporation
Home Financials for this Owner
Home Financials are based on the most recent Mortgage that was taken out on this home.
Original Mortgage
$92,449
Outstanding Balance
$38,251
Interest Rate
6.24%
Mortgage Type
FHA
Estimated Equity
$241,547
Purchase Details
Closed on
May 31, 2002
Sold by
Walker Jon Michael
Bought by
First Horizon Home Loan Corp
Create a Home Valuation Report for This Property
The Home Valuation Report is an in-depth analysis detailing your home's value as well as a comparison with similar homes in the area
Home Values in the Area
Average Home Value in this Area
Purchase History
| Date | Buyer | Sale Price | Title Company |
|---|---|---|---|
| Vergara Feliciano | $93,900 | Western Pioneer Title | |
| Federal Home Loan Mortgage Corporation | $72,800 | Western Pioneer Title Co | |
| First Horizon Home Loan Corp | $72,800 | Western Pioneer Title Co |
Source: Public Records
Mortgage History
| Date | Status | Borrower | Loan Amount |
|---|---|---|---|
| Open | Vergara Feliciano | $92,449 |
Source: Public Records
Tax History Compared to Growth
Tax History
| Year | Tax Paid | Tax Assessment Tax Assessment Total Assessment is a certain percentage of the fair market value that is determined by local assessors to be the total taxable value of land and additions on the property. | Land | Improvement |
|---|---|---|---|---|
| 2025 | $2,326 | $126,822 | -- | -- |
| 2024 | $2,288 | $123,129 | -- | -- |
| 2023 | $2,288 | $119,543 | $0 | $0 |
| 2022 | $2,119 | $116,062 | $0 | $0 |
| 2021 | $2,081 | $112,682 | $0 | $0 |
| 2020 | $2,020 | $109,400 | $0 | $0 |
| 2019 | $1,960 | $106,214 | $0 | $0 |
| 2018 | $1,847 | $100,117 | $0 | $0 |
| 2017 | $1,776 | $100,117 | $0 | $0 |
| 2016 | $1,739 | $97,201 | $0 | $0 |
| 2015 | $1,689 | $94,370 | $0 | $0 |
| 2014 | $1,664 | $91,621 | $0 | $0 |
Source: Public Records
Map
Nearby Homes
- 1042 3rd Place
- 1064 3rd Place
- 1034 3rd Place
- 1100 3rd Place
- 1055 3rd Place
- 1016 3rd Place
- 1016 N 3rd Place
- 1065 3rd Place
- 1045 3rd Place
- 1110 Custom Way
- 1033 3rd Place
- 1105 3rd Place
- 1022 3rd Place
- 1023 3rd Place
- 1119 3rd Place
- 1122 Custom Way
- 1130 Custom Way
- 1005 3rd Place
- 1133 Custom Way
- 1000 N 3rd Place