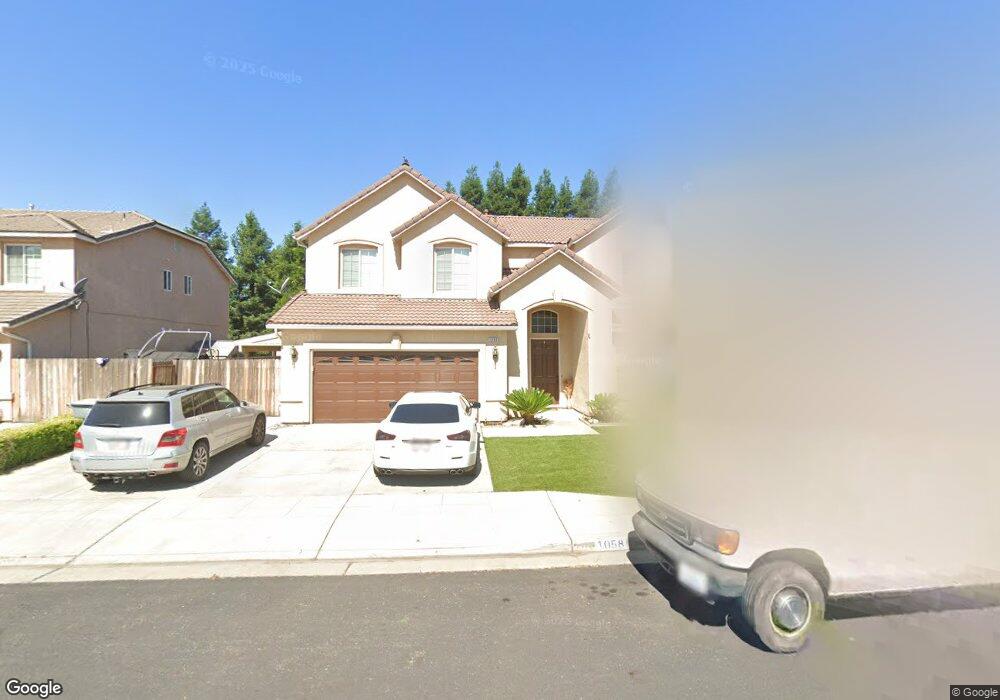
1058 Coventry Ave Clovis, CA 93611
Estimated Value: $557,549 - $616,000
5
Beds
4
Baths
2,687
Sq Ft
$222/Sq Ft
Est. Value
About This Home
This home is located at 1058 Coventry Ave, Clovis, CA 93611 and is currently estimated at $596,183, approximately $221 per square foot. 1058 Coventry Ave is a home located in Fresno County with nearby schools including Red Bank Elementary School, Clark Intermediate School, and Clovis High School.
Ownership History
Date
Name
Owned For
Owner Type
Purchase Details
Closed on
Apr 15, 2004
Sold by
Brar Satwinder and Brar Sukhpal
Bought by
Brar Sukhpal and Brar Satwinder
Current Estimated Value
Home Financials for this Owner
Home Financials are based on the most recent Mortgage that was taken out on this home.
Original Mortgage
$218,000
Interest Rate
5.57%
Mortgage Type
New Conventional
Purchase Details
Closed on
Dec 23, 2003
Sold by
Brar Satwinder
Bought by
Brar Satwinder and Brar Sukhpal
Purchase Details
Closed on
Oct 14, 2003
Sold by
Fox Run Llc
Bought by
Brar Satwinder
Home Financials for this Owner
Home Financials are based on the most recent Mortgage that was taken out on this home.
Original Mortgage
$213,868
Interest Rate
5.98%
Mortgage Type
Purchase Money Mortgage
Purchase Details
Closed on
Jul 14, 2003
Sold by
Brar Sukhpal
Bought by
Brar Satwinder
Purchase Details
Closed on
Oct 26, 2001
Sold by
Tatham William
Bought by
Fox Run Llc
Create a Home Valuation Report for This Property
The Home Valuation Report is an in-depth analysis detailing your home's value as well as a comparison with similar homes in the area
Home Values in the Area
Average Home Value in this Area
Purchase History
| Date | Buyer | Sale Price | Title Company |
|---|---|---|---|
| Brar Sukhpal | -- | First American Title Ins Co | |
| Brar Satwinder | -- | -- | |
| Brar Satwinder | $267,500 | North American Title Co Inc | |
| Brar Satwinder | -- | North American Title Co Inc | |
| Fox Run Llc | -- | North American Title Co |
Source: Public Records
Mortgage History
| Date | Status | Borrower | Loan Amount |
|---|---|---|---|
| Closed | Brar Sukhpal | $218,000 | |
| Closed | Brar Satwinder | $213,868 |
Source: Public Records
Tax History
| Year | Tax Paid | Tax Assessment Tax Assessment Total Assessment is a certain percentage of the fair market value that is determined by local assessors to be the total taxable value of land and additions on the property. | Land | Improvement |
|---|---|---|---|---|
| 2025 | $4,829 | $395,079 | $99,517 | $295,562 |
| 2023 | $4,637 | $379,739 | $95,653 | $284,086 |
| 2022 | $4,578 | $372,294 | $93,778 | $278,516 |
| 2021 | $4,454 | $364,995 | $91,940 | $273,055 |
| 2020 | $4,437 | $361,254 | $90,998 | $270,256 |
| 2019 | $4,354 | $354,171 | $89,214 | $264,957 |
| 2018 | $4,262 | $347,227 | $87,465 | $259,762 |
| 2017 | $4,179 | $340,419 | $85,750 | $254,669 |
| 2016 | $4,042 | $333,745 | $84,069 | $249,676 |
| 2015 | $3,982 | $328,733 | $82,807 | $245,926 |
| 2014 | $3,911 | $322,294 | $81,185 | $241,109 |
Source: Public Records
Map
Nearby Homes
- 2681 Wrenwood Ave
- 923 Ryan Ave
- 793 Applegate Ave
- 1322 Carson Ave
- 731 Hanson Ave
- 637 Coventry Ave
- 2682 Morris Ave
- 2586 Roberts Ave
- 2691 Morris Ave
- 612 Hanson Ave
- 2746 Beverly Ave
- 2549 Purvis Ave
- 3076 Portals Ave
- 2668 Scott Ave
- 603 Kaweah Ave
- 1047 Maine Ave
- 2337 Wrenwood Ave
- 3154 Mitchell Ave
- 3045 Keats Ave
- 2526 Gibson Ave
- 1038 Coventry Ave
- 1078 Coventry Ave
- 1078 Coventry Ave
- 2735 Robinwood Ave
- 1088 Coventry Ave
- 1018 Coventry Ave
- 2734 Finchwood Ave
- 1053 Coventry Ave
- 1033 Coventry Ave
- 2746 Robinwood Ave
- 1073 Coventry Ave
- 2725 Robinwood Ave
- 1098 Coventry Ave
- 2724 Finchwood Ave
- 1013 Coventry Ave
- 1093 Coventry Ave
- 1092 Carson Ave
- 2736 Robinwood Ave
- 1003 Coventry Ave
- 1103 Coventry Ave
Your Personal Tour Guide
Ask me questions while you tour the home.