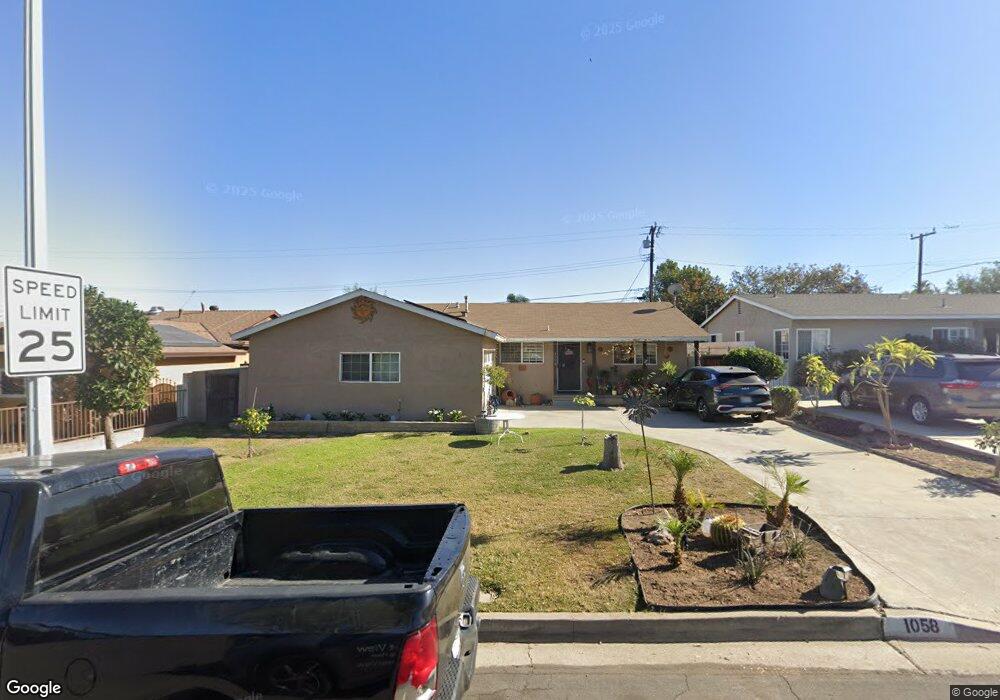
1058 Doverfield Ave Hacienda Heights, CA 91745
Estimated Value: $750,000 - $829,424
4
Beds
2
Baths
1,454
Sq Ft
$549/Sq Ft
Est. Value
About This Home
This home is located at 1058 Doverfield Ave, Hacienda Heights, CA 91745 and is currently estimated at $798,856, approximately $549 per square foot. 1058 Doverfield Ave is a home located in Los Angeles County with nearby schools including Palm Elementary School, Orange Grove Middle School, and Los Altos High School.
Ownership History
Date
Name
Owned For
Owner Type
Purchase Details
Closed on
Feb 7, 2011
Sold by
Gomez Maria
Bought by
Gomez Eduardo
Current Estimated Value
Home Financials for this Owner
Home Financials are based on the most recent Mortgage that was taken out on this home.
Original Mortgage
$118,000
Interest Rate
4.9%
Mortgage Type
New Conventional
Purchase Details
Closed on
Feb 3, 2011
Sold by
Gomez Irma and Gomez Javier
Bought by
Gomez Irma and Gomez Javier
Home Financials for this Owner
Home Financials are based on the most recent Mortgage that was taken out on this home.
Original Mortgage
$118,000
Interest Rate
4.9%
Mortgage Type
New Conventional
Purchase Details
Closed on
May 22, 2010
Sold by
Gomez Eduardo
Bought by
Gomez Irma
Purchase Details
Closed on
Mar 9, 2010
Sold by
Gomez Rosalba
Bought by
Gomez Irma
Create a Home Valuation Report for This Property
The Home Valuation Report is an in-depth analysis detailing your home's value as well as a comparison with similar homes in the area
Home Values in the Area
Average Home Value in this Area
Purchase History
| Date | Buyer | Sale Price | Title Company |
|---|---|---|---|
| Gomez Eduardo | -- | Lawyers Title | |
| Gomez Irma | -- | Lawyers Title | |
| Gomez Irma | -- | None Available | |
| Gomez Irma | -- | None Available | |
| Gomez Irma | -- | None Available |
Source: Public Records
Mortgage History
| Date | Status | Borrower | Loan Amount |
|---|---|---|---|
| Previous Owner | Gomez Eduardo | $118,000 | |
| Previous Owner | Gomez Irma | $118,000 |
Source: Public Records
Tax History Compared to Growth
Tax History
| Year | Tax Paid | Tax Assessment Tax Assessment Total Assessment is a certain percentage of the fair market value that is determined by local assessors to be the total taxable value of land and additions on the property. | Land | Improvement |
|---|---|---|---|---|
| 2025 | $8,064 | $666,768 | $473,863 | $192,905 |
| 2024 | $8,064 | $653,695 | $464,572 | $189,123 |
| 2023 | $7,859 | $640,878 | $455,463 | $185,415 |
| 2022 | $3,429 | $257,349 | $91,784 | $165,565 |
| 2021 | $3,364 | $252,304 | $89,985 | $162,319 |
| 2019 | $3,268 | $244,822 | $87,317 | $157,505 |
| 2018 | $3,108 | $240,022 | $85,605 | $154,417 |
| 2016 | $2,873 | $230,704 | $82,282 | $148,422 |
| 2015 | $2,819 | $227,240 | $81,047 | $146,193 |
| 2014 | $2,777 | $222,790 | $79,460 | $143,330 |
Source: Public Records
Map
Nearby Homes
- 1038 Hedgepath Ave
- 14858 Gale Ave
- 14815 Novak St
- 14455 Marwood St
- 15149 Salt Lake Ave
- 15033 Gale Ave
- 1314 Ameluxen Ave
- 901 S 6th Ave Unit 238
- 901 S 6th Ave Unit 159
- 901 S 6th Ave Unit 447
- 901 S 6th Ave Unit 205
- 1325 Beech Hill Ave
- 1138 Valencia Ave Unit 40
- 1502 Hedgepath Ave
- 1454 Ameluxen Ave
- 1461 Ameluxen Ave
- 1139 Turnbull Canyon Rd Unit C
- 15226 Shadybend Dr Unit 32
- 1610 Golden View Dr
- 1614 Adalia Ave
- 1050 Doverfield Ave
- 1064 Doverfield Ave
- 1045 Hedgepath Ave
- 1039 Hedgepath Ave
- 1053 Hedgepath Ave
- 1044 Doverfield Ave
- 14629 Gale Ave
- 14624 Walbrook Dr
- 1033 Hedgepath Ave
- 1038 Doverfield Ave
- 1027 Hedgepath Ave
- 14623 Gale Ave
- 14618 Walbrook Dr
- 14627 Walbrook Dr
- 1032 Doverfield Ave
- 1044 Hedgepath Ave
- 1103 Hedgepath Ave
- 1052 Hedgepath Ave
- 1021 Hedgepath Ave
- 14617 Gale Ave